
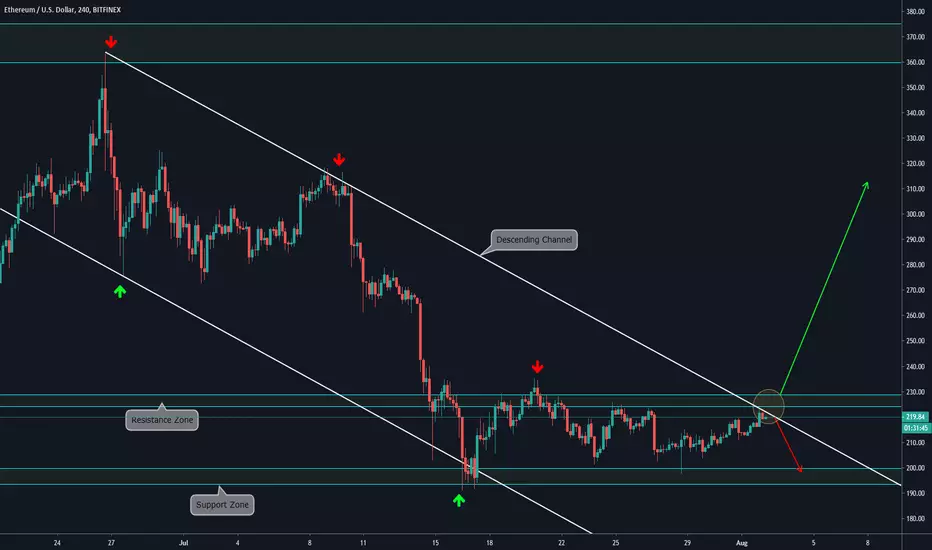
4H CHART EXPLANATION:
We observe that Ethereum has been moving sideways for a few days, and now it is facing the Descending Trendline and the Resistance Zone. If this zone is broke, we expect a bullish movement towards the next Resistance Zone. And, in case this zone can hold the price, it may bounce and retest the Support Zone again. Major movements are explained on the higher timeframes below.
MULTI TIMEFRAME ANALYSIS:
-Daily:

-Weekly:

We observe that Ethereum has been moving sideways for a few days, and now it is facing the Descending Trendline and the Resistance Zone. If this zone is broke, we expect a bullish movement towards the next Resistance Zone. And, in case this zone can hold the price, it may bounce and retest the Support Zone again. Major movements are explained on the higher timeframes below.
MULTI TIMEFRAME ANALYSIS:
-Daily:
-Weekly:

Haftungsausschluss
Die Informationen und Veröffentlichungen sind nicht als Finanz-, Anlage-, Handels- oder andere Arten von Ratschlägen oder Empfehlungen gedacht, die von TradingView bereitgestellt oder gebilligt werden, und stellen diese nicht dar. Lesen Sie mehr in den Nutzungsbedingungen.
Haftungsausschluss
Die Informationen und Veröffentlichungen sind nicht als Finanz-, Anlage-, Handels- oder andere Arten von Ratschlägen oder Empfehlungen gedacht, die von TradingView bereitgestellt oder gebilligt werden, und stellen diese nicht dar. Lesen Sie mehr in den Nutzungsbedingungen.