
Hello Traders! Champ_of_Gold here with a fresh technical breakdown on ETHUSD.
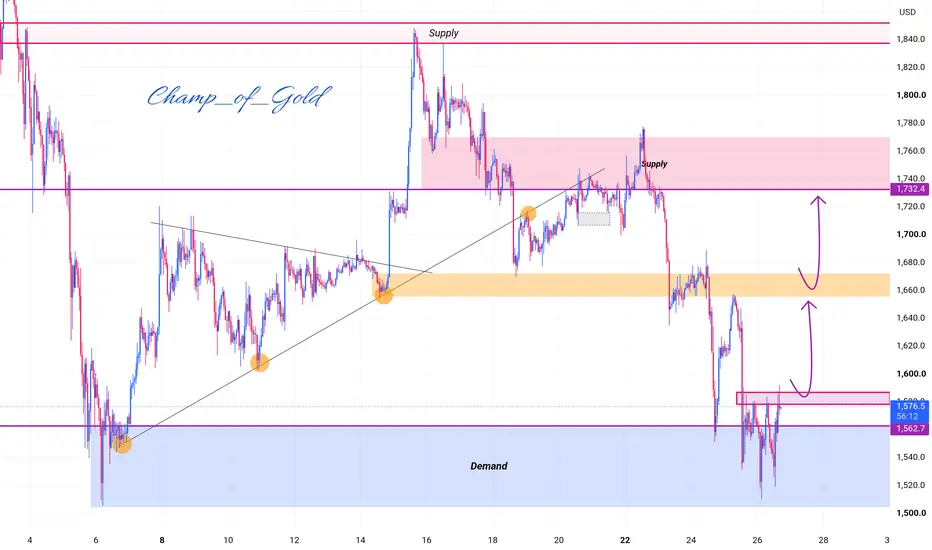
Looking at the 1-hour chart, Ethereum has recently put in a massive liquidity hunt, tapping deep into our primary macro Demand Zone before showing strong signs of exhaustion from the sellers. Here is how the structure is shaping up and how we can look to trade it.
🔍 Technical Overview & Market Structure
Major Demand Validation: Price tested the major blue demand cluster spanning from $1,500 to $1,562. After a sharp sweep below the key support level of $1,562.7, buyers stepped in aggressively, leaving a clear liquidity wick behind.
current Price Action: ETH is currently trading around $1,576, struggling just beneath a minor internal supply block (marked in pink).
🗺️ Key Levels to Watch
Immediate Support: $1,562.7 (Must hold to maintain immediate bullish momentum).
Immediate Hurdle (Pink Box): $1,590 – $1,600.
Target 1 (Orange Zone): $1,660 – $1,670.
Target 2 (Major Resistance): $1,732.4.
🚀 The Execution Plan (Two-Step Confirmation)
We are looking for a structural shift to confirm the buyers are fully back in control. We are tracking two primary legs for this potential upside expansion:
Leg 1 (The Breakout): A clean hourly close above the immediate minor pink supply zone (~$1,590) will trigger the first long opportunity, aiming directly for the Orange Resistance Zone around $1,660.
[Leg 2 (The Continuation): If price consolidates and cleanly breaks above the $1,660 orange barrier, it opens up the pathway for a retest of the major structural high at $1,732.4.
⚠️ Risk Management Note: Keep an eye on the immediate lows. A sustained close back inside the lower demand zone invalidates this immediate bullish setup. Always protect your capital!
What are your thoughts on Ethereum's current structure? Are you buying the dip or waiting for further confirmation?
⚡ If you find this analysis helpful, please show some love by hitting the Boost button and leaving your comments below! For daily setups and real-time updates, make sure to follow my profile.
Trade Safe,
Champ_of_Gold
Disclaimer: This analysis is for educational purposes only and does not constitute financial advice. Always perform your own research before executing trades.
Looking at the 1-hour chart, Ethereum has recently put in a massive liquidity hunt, tapping deep into our primary macro Demand Zone before showing strong signs of exhaustion from the sellers. Here is how the structure is shaping up and how we can look to trade it.
🔍 Technical Overview & Market Structure
Major Demand Validation: Price tested the major blue demand cluster spanning from $1,500 to $1,562. After a sharp sweep below the key support level of $1,562.7, buyers stepped in aggressively, leaving a clear liquidity wick behind.
current Price Action: ETH is currently trading around $1,576, struggling just beneath a minor internal supply block (marked in pink).
🗺️ Key Levels to Watch
Immediate Support: $1,562.7 (Must hold to maintain immediate bullish momentum).
Immediate Hurdle (Pink Box): $1,590 – $1,600.
Target 1 (Orange Zone): $1,660 – $1,670.
Target 2 (Major Resistance): $1,732.4.
🚀 The Execution Plan (Two-Step Confirmation)
We are looking for a structural shift to confirm the buyers are fully back in control. We are tracking two primary legs for this potential upside expansion:
Leg 1 (The Breakout): A clean hourly close above the immediate minor pink supply zone (~$1,590) will trigger the first long opportunity, aiming directly for the Orange Resistance Zone around $1,660.
[Leg 2 (The Continuation): If price consolidates and cleanly breaks above the $1,660 orange barrier, it opens up the pathway for a retest of the major structural high at $1,732.4.
⚠️ Risk Management Note: Keep an eye on the immediate lows. A sustained close back inside the lower demand zone invalidates this immediate bullish setup. Always protect your capital!
What are your thoughts on Ethereum's current structure? Are you buying the dip or waiting for further confirmation?
⚡ If you find this analysis helpful, please show some love by hitting the Boost button and leaving your comments below! For daily setups and real-time updates, make sure to follow my profile.
Trade Safe,
Champ_of_Gold
Disclaimer: This analysis is for educational purposes only and does not constitute financial advice. Always perform your own research before executing trades.
Trade ist aktiv
ETH Demand Zone Update: Part 2 Ref: The Target View
Target 1 (Immediate): $1,640 (The Bearish ob). Expect local resistance here; secure partials or trail your stop.
Target 2 (Main Objective): $1,732 – $1,770 (Major HTF Supply).
The Path to $1,770
The Key Obstacle: The orange zone at $1,660 (previous multi-touch support).
The Break: A clean daily close above $1,660 clears the path and confirms the full institutional expansion straight into the $1,770 supply target.
Ready to push this to the channel?

🏛️ XAUUSD | SMC & ICT
💎 VIP: 8-10 Daily Sniper Signals ➔
t.me/+wsTB6EFFcpgzZDQ0
📢 Free Community ➔ t.me/+I27cRTl31Zk0YzA0
💎 VIP: 8-10 Daily Sniper Signals ➔
t.me/+wsTB6EFFcpgzZDQ0
📢 Free Community ➔ t.me/+I27cRTl31Zk0YzA0
Verbundene Veröffentlichungen
Haftungsausschluss
Die Informationen und Veröffentlichungen sind nicht als Finanz-, Anlage-, Handels- oder andere Arten von Ratschlägen oder Empfehlungen gedacht, die von TradingView bereitgestellt oder gebilligt werden, und stellen diese nicht dar. Lesen Sie mehr in den Nutzungsbedingungen.
🏛️ XAUUSD | SMC & ICT
💎 VIP: 8-10 Daily Sniper Signals ➔
t.me/+wsTB6EFFcpgzZDQ0
📢 Free Community ➔ t.me/+I27cRTl31Zk0YzA0
💎 VIP: 8-10 Daily Sniper Signals ➔
t.me/+wsTB6EFFcpgzZDQ0
📢 Free Community ➔ t.me/+I27cRTl31Zk0YzA0
Verbundene Veröffentlichungen
Haftungsausschluss
Die Informationen und Veröffentlichungen sind nicht als Finanz-, Anlage-, Handels- oder andere Arten von Ratschlägen oder Empfehlungen gedacht, die von TradingView bereitgestellt oder gebilligt werden, und stellen diese nicht dar. Lesen Sie mehr in den Nutzungsbedingungen.