
ETHUSD Bearish Rejection | Respecting Descending Trendline Resistance 📉
Description:
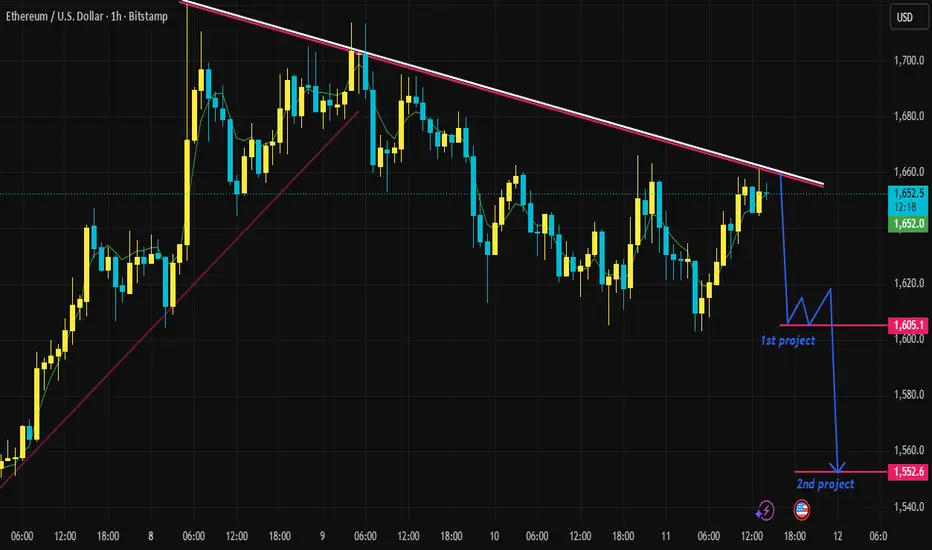
Ethereum (ETHUSD) is currently showing signs of bearish rejection on the 1H timeframe. Price recently rallied up to test a prominent descending trendline that has been capping the bullish momentum over the past few sessions.
Sellers actively defended this trendline dynamic resistance, preventing a clean breakout and leaving a noticeable rejection wick. As long as the price trades below this descending resistance line, the immediate bias remains bearish, setting up a potential corrective wave down to sweep internal liquidity pools and clean support levels below.
Key Structural Levels:
🔴 Trendline Invalidation Zone: 1,660.0 – 1,665.0 (Body close above trendline)
📉 Current Rejection Level: 1,651.5
🔵 1st Bearish Objective: 1,605.1
🔵 2nd Bearish Objective: 1,552.6
Trading Perspective:
Look for execution setups on lower timeframes (M15/M5) inside the rejection zone to catch the impulsive leg down toward the targets. A strong hourly candle body close above the descending trendline structure will completely invalidate this short setup.
This analysis is based on technical structure and market behavior, not financial advice.
Description:
Ethereum (ETHUSD) is currently showing signs of bearish rejection on the 1H timeframe. Price recently rallied up to test a prominent descending trendline that has been capping the bullish momentum over the past few sessions.
Sellers actively defended this trendline dynamic resistance, preventing a clean breakout and leaving a noticeable rejection wick. As long as the price trades below this descending resistance line, the immediate bias remains bearish, setting up a potential corrective wave down to sweep internal liquidity pools and clean support levels below.
Key Structural Levels:
🔴 Trendline Invalidation Zone: 1,660.0 – 1,665.0 (Body close above trendline)
📉 Current Rejection Level: 1,651.5
🔵 1st Bearish Objective: 1,605.1
🔵 2nd Bearish Objective: 1,552.6
Trading Perspective:
Look for execution setups on lower timeframes (M15/M5) inside the rejection zone to catch the impulsive leg down toward the targets. A strong hourly candle body close above the descending trendline structure will completely invalidate this short setup.
This analysis is based on technical structure and market behavior, not financial advice.
Trade ist aktiv
active Trade wurde manuell geschlossen

Verbundene Veröffentlichungen
Haftungsausschluss
Die Informationen und Veröffentlichungen sind nicht als Finanz-, Anlage-, Handels- oder andere Arten von Ratschlägen oder Empfehlungen gedacht, die von TradingView bereitgestellt oder gebilligt werden, und stellen diese nicht dar. Lesen Sie mehr in den Nutzungsbedingungen.
Verbundene Veröffentlichungen
Haftungsausschluss
Die Informationen und Veröffentlichungen sind nicht als Finanz-, Anlage-, Handels- oder andere Arten von Ratschlägen oder Empfehlungen gedacht, die von TradingView bereitgestellt oder gebilligt werden, und stellen diese nicht dar. Lesen Sie mehr in den Nutzungsbedingungen.