
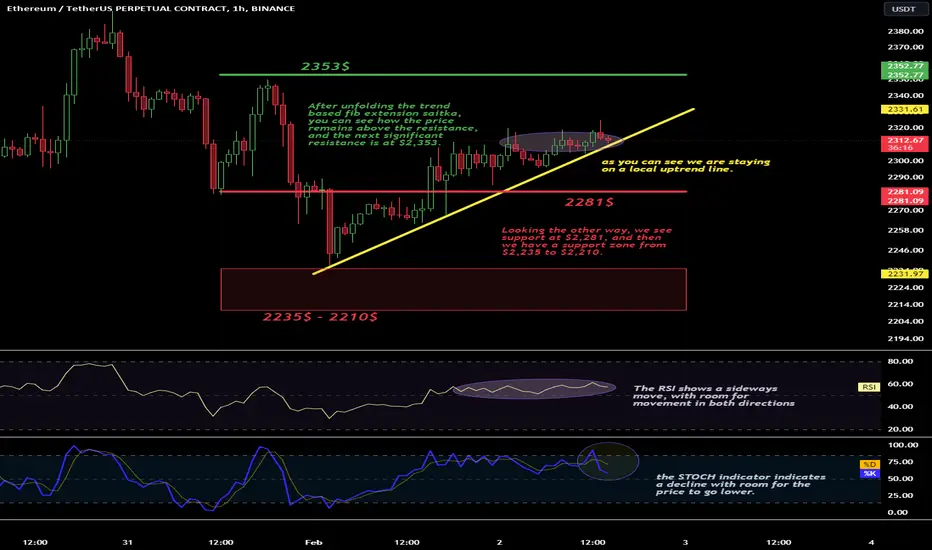
Hello everyone, let's look at the ETH to USDT chart on an hourly basis, as you can see we are staying on a local uptrend line.
After unfolding the trend based fib extension saitka, you can see how the price remains above the resistance, and the next significant resistance is at $2,353.
Looking the other way, we see support at $2,281, and then we have a support zone from $2,235 to $2,210.
The RSI shows a sideways move, with room for movement in both directions, while the STOCH indicator indicates a decline with room for the price to go lower.

Haftungsausschluss
Die Informationen und Veröffentlichungen sind nicht als Finanz-, Anlage-, Handels- oder andere Arten von Ratschlägen oder Empfehlungen gedacht, die von TradingView bereitgestellt oder gebilligt werden, und stellen diese nicht dar. Lesen Sie mehr in den Nutzungsbedingungen.
Haftungsausschluss
Die Informationen und Veröffentlichungen sind nicht als Finanz-, Anlage-, Handels- oder andere Arten von Ratschlägen oder Empfehlungen gedacht, die von TradingView bereitgestellt oder gebilligt werden, und stellen diese nicht dar. Lesen Sie mehr in den Nutzungsbedingungen.