
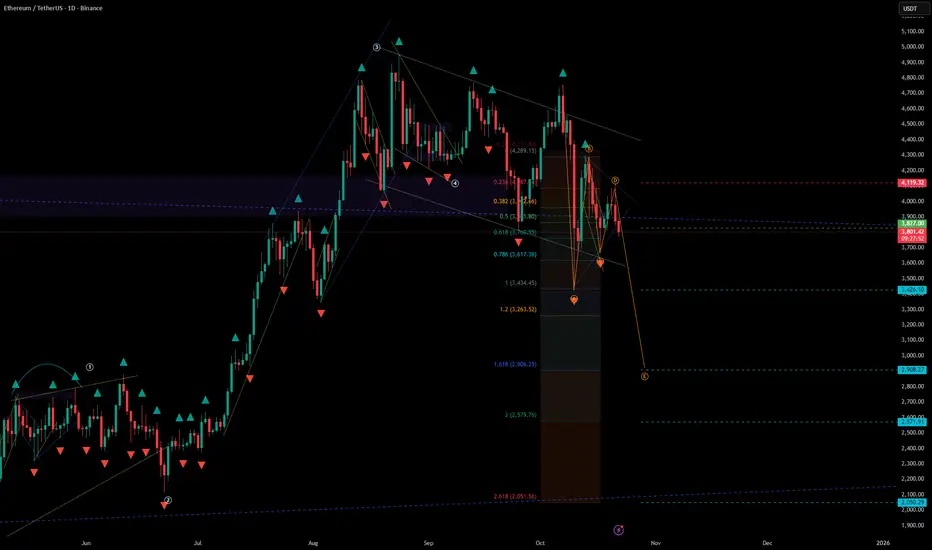
Ethereum #ETHUSDT – Bearish Continuation Structure
Current price: $3,827
Ethereum continues to trade within a descending channel, showing a clear pattern of lower highs and lower lows. The structure indicates potential for further downside extension before any meaningful recovery phase.
🧩 Technical Overview
• Price was rejected from the $4,120 resistance zone, confirming the upper boundary of the descending channel.
• The market failed to sustain above the $3,900 pivot and has since broken below the short-term trendline.
• Momentum remains weak, with sellers controlling the mid-term structure.
📉 Scenario
• The current move is likely part of a continuation correction, targeting deeper Fibonacci zones.
• Stop-loss: above $4,120, protecting against false breakouts.
• Downside zones to watch:
– $3,620–$3,440 — near 0.618 Fib / initial target area
– $3,260 — main support and prior reaction zone
– $2,900–$2,570 — extended targets aligning with 1.0–1.618 Fib projections
– $2,050–$2,000 — deep-cycle target (2.618 Fib extension)
• A break below $3,620 would confirm acceleration toward the lower targets.
⚙️ Market Context
• ETH underperforms BTC as capital rotation favors defensive positioning.
• Broader crypto sentiment remains cautious amid risk-off macro environment.
• The structure remains bearish unless ETH reclaims $3,900–$4,100 with strong momentum.
🧭 Summary
Ethereum is holding below key resistance and continues to follow a bearish channel structure.
Below $4,120, short-term bias remains downward, with focus on $3,440, $3,260, and $2,900 as successive support levels.
Reclaiming the $4,000 area would be the first sign of potential trend reversal — until then, the path of least resistance remains to the downside.
Current price: $3,827
Ethereum continues to trade within a descending channel, showing a clear pattern of lower highs and lower lows. The structure indicates potential for further downside extension before any meaningful recovery phase.
🧩 Technical Overview
• Price was rejected from the $4,120 resistance zone, confirming the upper boundary of the descending channel.
• The market failed to sustain above the $3,900 pivot and has since broken below the short-term trendline.
• Momentum remains weak, with sellers controlling the mid-term structure.
📉 Scenario
• The current move is likely part of a continuation correction, targeting deeper Fibonacci zones.
• Stop-loss: above $4,120, protecting against false breakouts.
• Downside zones to watch:
– $3,620–$3,440 — near 0.618 Fib / initial target area
– $3,260 — main support and prior reaction zone
– $2,900–$2,570 — extended targets aligning with 1.0–1.618 Fib projections
– $2,050–$2,000 — deep-cycle target (2.618 Fib extension)
• A break below $3,620 would confirm acceleration toward the lower targets.
⚙️ Market Context
• ETH underperforms BTC as capital rotation favors defensive positioning.
• Broader crypto sentiment remains cautious amid risk-off macro environment.
• The structure remains bearish unless ETH reclaims $3,900–$4,100 with strong momentum.
🧭 Summary
Ethereum is holding below key resistance and continues to follow a bearish channel structure.
Below $4,120, short-term bias remains downward, with focus on $3,440, $3,260, and $2,900 as successive support levels.
Reclaiming the $4,000 area would be the first sign of potential trend reversal — until then, the path of least resistance remains to the downside.

Haftungsausschluss
Die Informationen und Veröffentlichungen sind nicht als Finanz-, Anlage-, Handels- oder andere Arten von Ratschlägen oder Empfehlungen gedacht, die von TradingView bereitgestellt oder gebilligt werden, und stellen diese nicht dar. Lesen Sie mehr in den Nutzungsbedingungen.
Haftungsausschluss
Die Informationen und Veröffentlichungen sind nicht als Finanz-, Anlage-, Handels- oder andere Arten von Ratschlägen oder Empfehlungen gedacht, die von TradingView bereitgestellt oder gebilligt werden, und stellen diese nicht dar. Lesen Sie mehr in den Nutzungsbedingungen.