
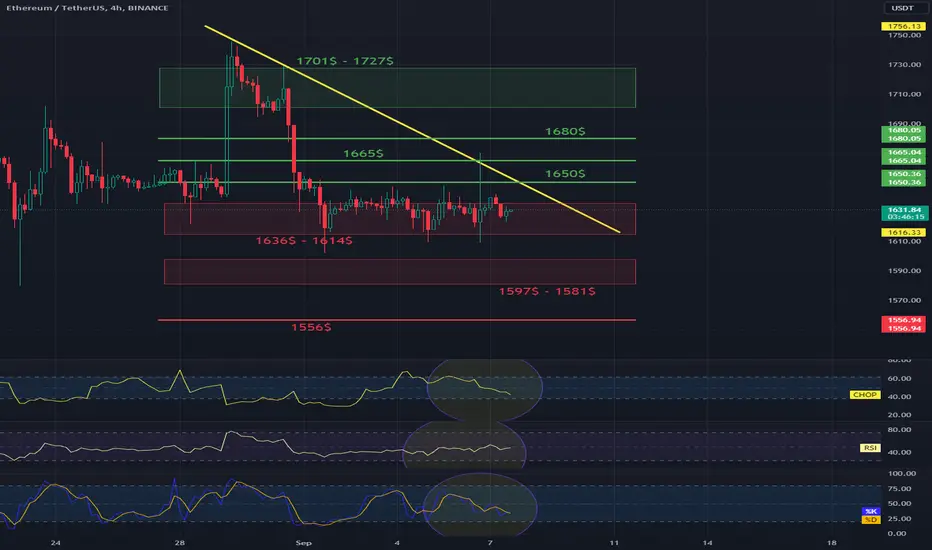
Hello everyone, let's take a look at the ETH to USDT chart on the 4-hour time frame. As you can see, the price is moving below the local downtrend line.
After unfolding the Trend Based Fib Extension grid, we see that the price stays in the support zone from $ 1636 to $ 1614, then there is the second zone from $ 1597 to $ 1581, and then support at $ 1556.
Looking the other way, we see that the first support is at $1650, the second is at $1665, the third is at $1680, and then we have a support zone from $1701 to $1727.
The CHOP index indicates that most of the energy has been used, the RSI is moving around the middle of the range, while the STOCH index indicates that there is less and less energy for further price drops.
After unfolding the Trend Based Fib Extension grid, we see that the price stays in the support zone from $ 1636 to $ 1614, then there is the second zone from $ 1597 to $ 1581, and then support at $ 1556.
Looking the other way, we see that the first support is at $1650, the second is at $1665, the third is at $1680, and then we have a support zone from $1701 to $1727.
The CHOP index indicates that most of the energy has been used, the RSI is moving around the middle of the range, while the STOCH index indicates that there is less and less energy for further price drops.

Haftungsausschluss
Die Informationen und Veröffentlichungen sind nicht als Finanz-, Anlage-, Handels- oder andere Arten von Ratschlägen oder Empfehlungen gedacht, die von TradingView bereitgestellt oder gebilligt werden, und stellen diese nicht dar. Lesen Sie mehr in den Nutzungsbedingungen.
Haftungsausschluss
Die Informationen und Veröffentlichungen sind nicht als Finanz-, Anlage-, Handels- oder andere Arten von Ratschlägen oder Empfehlungen gedacht, die von TradingView bereitgestellt oder gebilligt werden, und stellen diese nicht dar. Lesen Sie mehr in den Nutzungsbedingungen.