#ETH/USDT
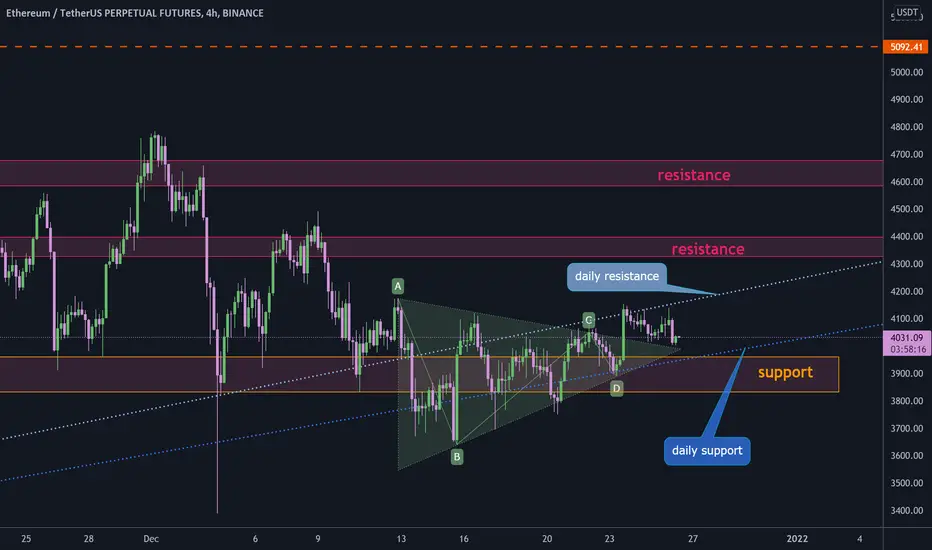
 ETH in daily chart is between to major ascending line that will show us the next move of #Ethereum. close a daily candle above daily ascending resistance will confirm the uptrend move and close a candle below daily ascending support will confirm down trend.
in 4h chart price broke out a triangle pattern and now pullback to this pattern. if price stay above triangle and head up to break out daily resistance it will increase toward $4350 and $4580 and maybe going to make a new ATH.
but if price drop below triangle and daily support zone we will see a long down trend to $3000.
ETH in daily chart is between to major ascending line that will show us the next move of #Ethereum. close a daily candle above daily ascending resistance will confirm the uptrend move and close a candle below daily ascending support will confirm down trend.in 4h chart price broke out a triangle pattern and now pullback to this pattern. if price stay above triangle and head up to break out daily resistance it will increase toward $4350 and $4580 and maybe going to make a new ATH.
but if price drop below triangle and daily support zone we will see a long down trend to $3000.

Haftungsausschluss
Die Informationen und Veröffentlichungen sind nicht als Finanz-, Anlage-, Handels- oder andere Arten von Ratschlägen oder Empfehlungen gedacht, die von TradingView bereitgestellt oder gebilligt werden, und stellen diese nicht dar. Lesen Sie mehr in den Nutzungsbedingungen.
Haftungsausschluss
Die Informationen und Veröffentlichungen sind nicht als Finanz-, Anlage-, Handels- oder andere Arten von Ratschlägen oder Empfehlungen gedacht, die von TradingView bereitgestellt oder gebilligt werden, und stellen diese nicht dar. Lesen Sie mehr in den Nutzungsbedingungen.