

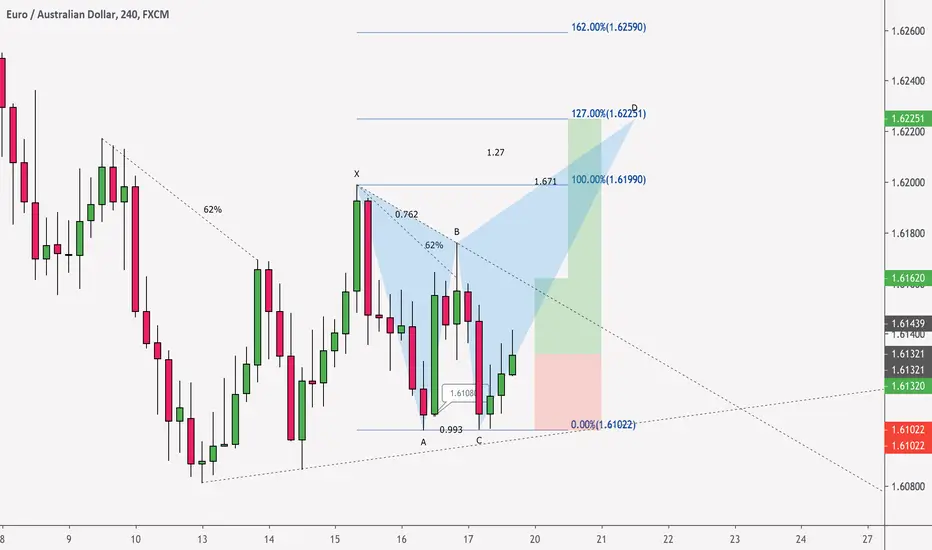
This chart appears to be forming a H&S pattern, but the bearish bias is not confirmed until the neckline has been breached. Until then I will be looking to long the Double Bottom pattern. Considering the 76% retracements there is high probability that price will rally up to complete the Butterfly.
Trendline break from ''XB'' indicates bullish momentum. A break above B confirms the butterfly. If any bullish wide range bars occurs from ''CD'' and/or at ''D'' it would be safe to target 162% XA.
Please leave a like and make sure you comment below with any idea regarding EUR/AUD
Thank you for reading
God bless and happy trading!
Trade geschlossen: Ziel wurde erreicht

Haftungsausschluss
Die Informationen und Veröffentlichungen sind nicht als Finanz-, Anlage-, Handels- oder andere Arten von Ratschlägen oder Empfehlungen gedacht, die von TradingView bereitgestellt oder gebilligt werden, und stellen diese nicht dar. Lesen Sie mehr in den Nutzungsbedingungen.
Haftungsausschluss
Die Informationen und Veröffentlichungen sind nicht als Finanz-, Anlage-, Handels- oder andere Arten von Ratschlägen oder Empfehlungen gedacht, die von TradingView bereitgestellt oder gebilligt werden, und stellen diese nicht dar. Lesen Sie mehr in den Nutzungsbedingungen.