

Hi Traders
EUR/CAD Multi-Timeframe analysis
H1 CHART ( BEARISH )
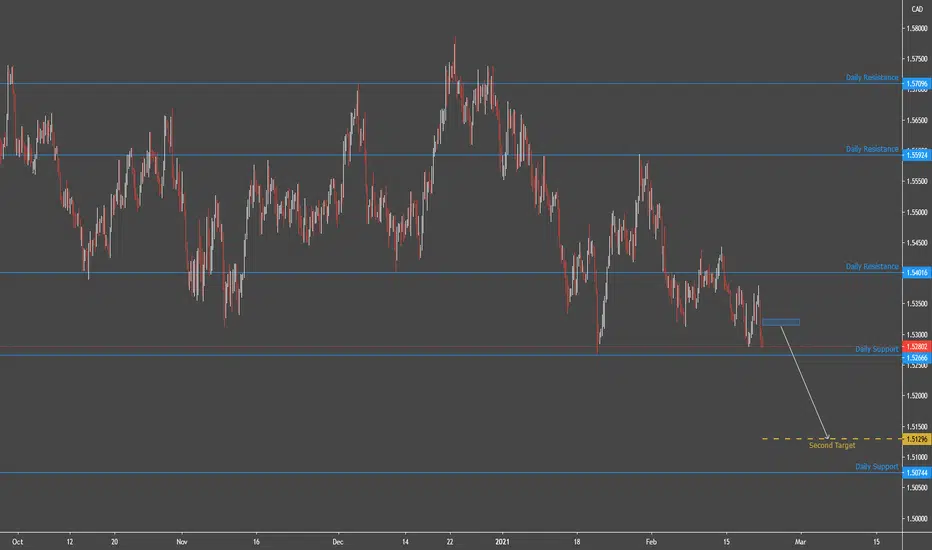
Waiting for a retracement higher towards the 1.53175 resistance level in order to reinstate SHORT positions. Next important resistance is the 1.53780 level.
Support & Resistances
1.52790 1.53175
1.52213 1.53780
1.51227 1.54766
H4 CHART ( BEARISH )
A medium high probability, entry signal to go SHORT was given at 1.53151 after the market found resistance at 1.53804 . Only the upward break of 1.53804 would cancel the bearish scenario.
Support & Resistances
1.53120 1.53782
1.52821 1.54414
1.52255 1.54980
DAILY CHART ( NEUTRAL )
The market is dominated by uncertainty. The occasionally prevailing trend lasts for a limited time and changes its direction too frequently. As long as the market remains unstable, we stay aside, waiting for the market to get back on track.
Support & Resistances
1.52666 1.54016
1.50744 1.55924
1.47486 1.57096
WEEKLY CHART ( NEUTRAL )
The market is dominated by uncertainty. The occasionally prevailing trend lasts for a limited time and changes its direction too frequently. As long as the market remains unstable, we stay aside, waiting for the market to get back on track.
Support & Resistances
1.52666 1.59912
1.50518 1.62060
1.47707 1.64871

GET MY FREE EDUCATION HERE:
bit.ly/3pQudRX
bit.ly/3pQudRX
Haftungsausschluss
Die Informationen und Veröffentlichungen sind nicht als Finanz-, Anlage-, Handels- oder andere Arten von Ratschlägen oder Empfehlungen gedacht, die von TradingView bereitgestellt oder gebilligt werden, und stellen diese nicht dar. Lesen Sie mehr in den Nutzungsbedingungen.