

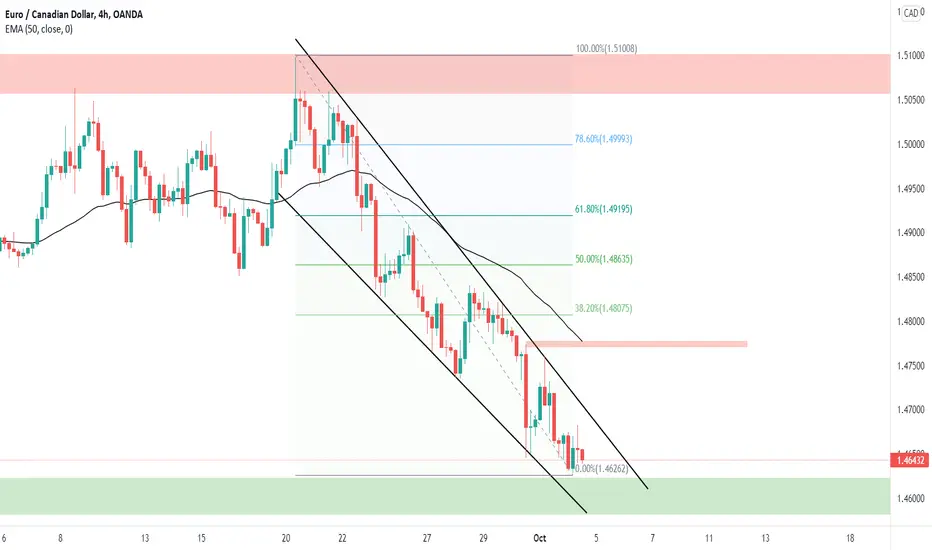
Bullish indicators:
1) Trading near major support area of 1.46100
2) Bullish Harami candle
3) Falling wedge
Bearish Indicators:
1) LL LH
2) Currently trading in downward trend
Plan A: On the bounce from the support area one can buy for the target 1.47733 first and then for the 1.48075.
Plan B: On the breaking of trendline and support one can sell for the target of 1.45826 where the major support lies.
1) Trading near major support area of 1.46100
2) Bullish Harami candle
3) Falling wedge
Bearish Indicators:
1) LL LH
2) Currently trading in downward trend
Plan A: On the bounce from the support area one can buy for the target 1.47733 first and then for the 1.48075.
Plan B: On the breaking of trendline and support one can sell for the target of 1.45826 where the major support lies.

Haftungsausschluss
Die Informationen und Veröffentlichungen sind nicht als Finanz-, Anlage-, Handels- oder andere Arten von Ratschlägen oder Empfehlungen gedacht, die von TradingView bereitgestellt oder gebilligt werden, und stellen diese nicht dar. Lesen Sie mehr in den Nutzungsbedingungen.
Haftungsausschluss
Die Informationen und Veröffentlichungen sind nicht als Finanz-, Anlage-, Handels- oder andere Arten von Ratschlägen oder Empfehlungen gedacht, die von TradingView bereitgestellt oder gebilligt werden, und stellen diese nicht dar. Lesen Sie mehr in den Nutzungsbedingungen.