

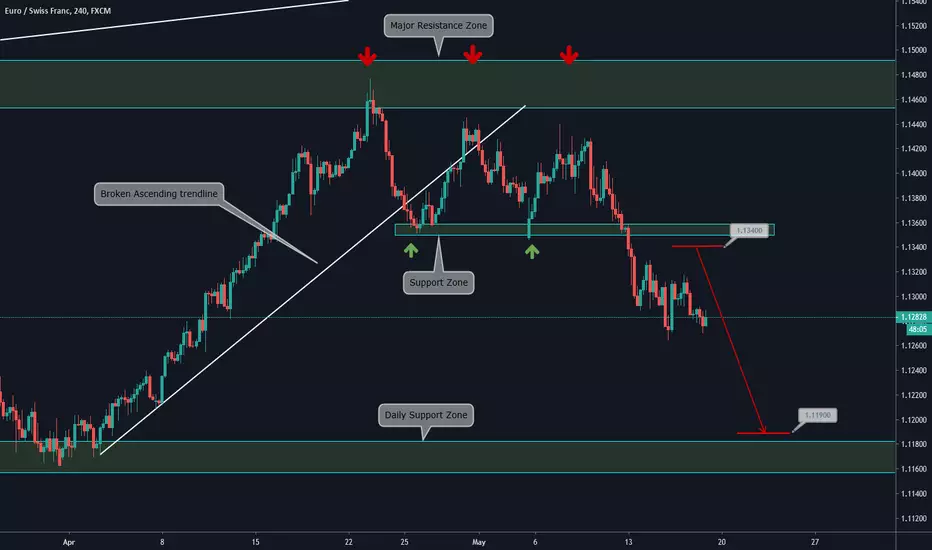
4H CHART EXPLANATION:
Main Items we Observe on the Chart:
-On April 2019 price broke the ascending trend line
-After that, price started a corrective structure
-As we saw on the weekly analysis the price couldn't surpass the resistance zone and made a breakout of the corrective structure, starting a bearish movement
Based on this, as the price breaks out below 1.13400 with close candlesticks we expect a continuation of the descending movement towards 1.11900
Expect corrective structures to be formed on the way to the support zone
MULTI TIMEFRAME VISION:
Weekly:

Daily:

Main Items we Observe on the Chart:
-On April 2019 price broke the ascending trend line
-After that, price started a corrective structure
-As we saw on the weekly analysis the price couldn't surpass the resistance zone and made a breakout of the corrective structure, starting a bearish movement
Based on this, as the price breaks out below 1.13400 with close candlesticks we expect a continuation of the descending movement towards 1.11900
Expect corrective structures to be formed on the way to the support zone
MULTI TIMEFRAME VISION:
Weekly:
Daily:

Haftungsausschluss
Die Informationen und Veröffentlichungen sind nicht als Finanz-, Anlage-, Handels- oder andere Arten von Ratschlägen oder Empfehlungen gedacht, die von TradingView bereitgestellt oder gebilligt werden, und stellen diese nicht dar. Lesen Sie mehr in den Nutzungsbedingungen.
Haftungsausschluss
Die Informationen und Veröffentlichungen sind nicht als Finanz-, Anlage-, Handels- oder andere Arten von Ratschlägen oder Empfehlungen gedacht, die von TradingView bereitgestellt oder gebilligt werden, und stellen diese nicht dar. Lesen Sie mehr in den Nutzungsbedingungen.