

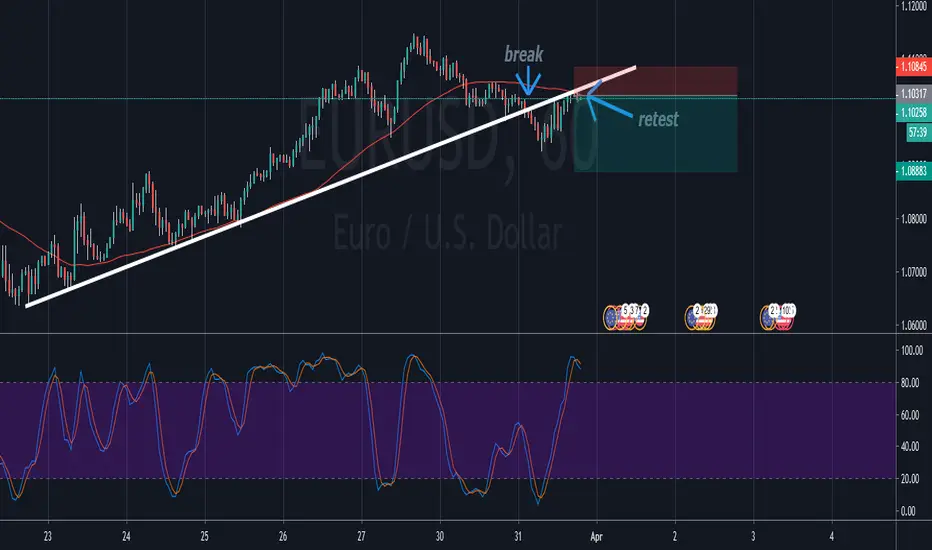
On the daily time frame on EURUSD, price looked like it wants to downtrend. So on the one hour time frame, I was looking for selling opportunities. thus on the daily, there is a possible 1-2-3 move, and on the one hour time frame, I made a trend line. To continue, price broke this trend line and retested. As all this was happening, price remained below the 50 moving average, thus indicating a sellers market. Finally, with the stochastic indicator reading over bought, this was the final indicator i needed to confirm price may potentially continue down trending on the daily. The green zone marks take profit potentials, and the red zone marks a stop loss, great 3:1 ratio in profit potential. Also, from the previous high, to the previous low, the Fibonacci retracement is on a perfect 50%

Haftungsausschluss
Die Informationen und Veröffentlichungen sind nicht als Finanz-, Anlage-, Handels- oder andere Arten von Ratschlägen oder Empfehlungen gedacht, die von TradingView bereitgestellt oder gebilligt werden, und stellen diese nicht dar. Lesen Sie mehr in den Nutzungsbedingungen.
Haftungsausschluss
Die Informationen und Veröffentlichungen sind nicht als Finanz-, Anlage-, Handels- oder andere Arten von Ratschlägen oder Empfehlungen gedacht, die von TradingView bereitgestellt oder gebilligt werden, und stellen diese nicht dar. Lesen Sie mehr in den Nutzungsbedingungen.