

1. High-Horizon Structural Program
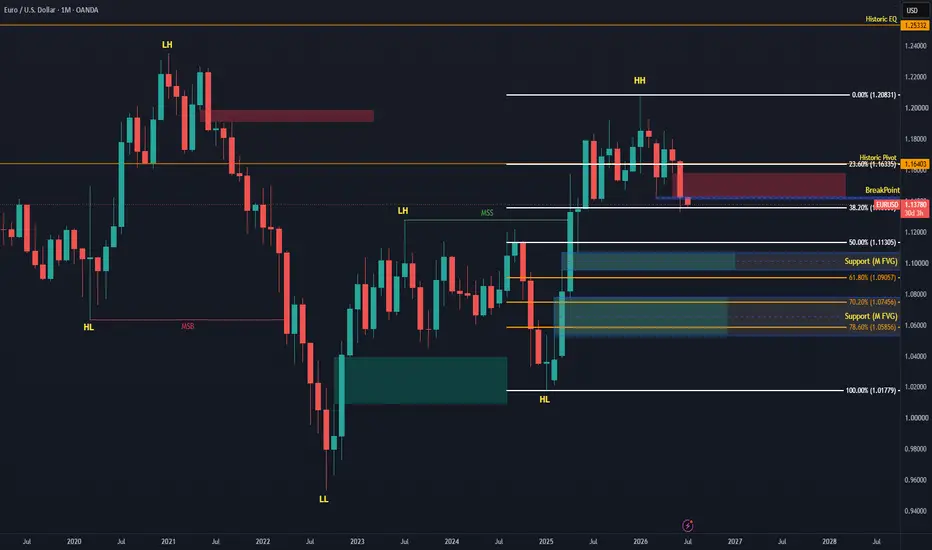
A top-down audit of the Monthly chart confirms that the June candle did not cleanly break the macro 1.14110 baseline established in March 2026. This displacement leg is actively printing the third candle of a massive Monthly Fair Value Gap (M-FVG) expansion, signaling absolute sell-side dominance across high-level order books.
2. Spatial Mapping: The Fibonacci OTE Matrix
Measuring the internal liquidity cycle from the macro Higher Low (1.01779) to the Higher High (1.20831), the market has broken out of premium valuation arrays and is accelerating toward long-term discount coordinates:
Primary Draw on Price: The 50.00% Equilibrium vector rests at 1.11305.
Core OTE Support Grid: Beneath Equilibrium, higher-probability institutional target arrays converge inside the 61.80% (1.09057) to 78.60% (1.05856) Fibonacci band. This zone contains two heavily defined Support (M FVG) imbalances designed to absorb macro-scale buy matching volume.
3. Operational Guardrails
Our bias remains strictly, cautiously bearish. While localized counter-trend rebalancing to mitigate the newly formed M-FVG remains a structural possibility over a multi-week horizon, the technical path of least resistance points downward.
We do not force exposure on incomplete data. The system monitors the daily footprint adjustments and as the macro monthly receipt prints.
A top-down audit of the Monthly chart confirms that the June candle did not cleanly break the macro 1.14110 baseline established in March 2026. This displacement leg is actively printing the third candle of a massive Monthly Fair Value Gap (M-FVG) expansion, signaling absolute sell-side dominance across high-level order books.
2. Spatial Mapping: The Fibonacci OTE Matrix
Measuring the internal liquidity cycle from the macro Higher Low (1.01779) to the Higher High (1.20831), the market has broken out of premium valuation arrays and is accelerating toward long-term discount coordinates:
Primary Draw on Price: The 50.00% Equilibrium vector rests at 1.11305.
Core OTE Support Grid: Beneath Equilibrium, higher-probability institutional target arrays converge inside the 61.80% (1.09057) to 78.60% (1.05856) Fibonacci band. This zone contains two heavily defined Support (M FVG) imbalances designed to absorb macro-scale buy matching volume.
3. Operational Guardrails
Our bias remains strictly, cautiously bearish. While localized counter-trend rebalancing to mitigate the newly formed M-FVG remains a structural possibility over a multi-week horizon, the technical path of least resistance points downward.
We do not force exposure on incomplete data. The system monitors the daily footprint adjustments and as the macro monthly receipt prints.

Haftungsausschluss
Die Informationen und Veröffentlichungen sind nicht als Finanz-, Anlage-, Handels- oder andere Arten von Ratschlägen oder Empfehlungen gedacht, die von TradingView bereitgestellt oder gebilligt werden, und stellen diese nicht dar. Lesen Sie mehr in den Nutzungsbedingungen.
Haftungsausschluss
Die Informationen und Veröffentlichungen sind nicht als Finanz-, Anlage-, Handels- oder andere Arten von Ratschlägen oder Empfehlungen gedacht, die von TradingView bereitgestellt oder gebilligt werden, und stellen diese nicht dar. Lesen Sie mehr in den Nutzungsbedingungen.