

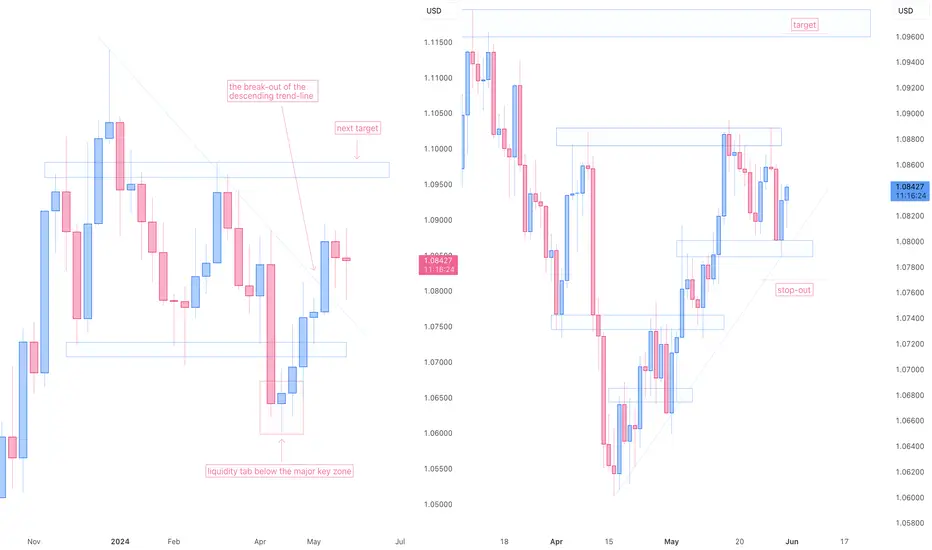
Initially, looking at the Weekly-timeframe chart on the left-hand side of the screen, it could be inferred that the price has been unable to break below the major key zone of 1.072 and, ever since, it has been impulsing in the upside destination. Judging by the ongoing build-up, the bullish wave does not show any signs of stoppage and is continuing to move in the upward direction after having broken out of the descending trend-line highlighted on the chart.
Zooming into the Daily timeframe, the zone-to-zone movement of the price could be clearly noticed. Thus, holding on to our bullish sentiment, we are executing long positions with the stop-out order below the ongoing build-up and the target level set at key level identified on the Weekly timeframe.
Zooming into the Daily timeframe, the zone-to-zone movement of the price could be clearly noticed. Thus, holding on to our bullish sentiment, we are executing long positions with the stop-out order below the ongoing build-up and the target level set at key level identified on the Weekly timeframe.

Haftungsausschluss
Die Informationen und Veröffentlichungen sind nicht als Finanz-, Anlage-, Handels- oder andere Arten von Ratschlägen oder Empfehlungen gedacht, die von TradingView bereitgestellt oder gebilligt werden, und stellen diese nicht dar. Lesen Sie mehr in den Nutzungsbedingungen.
Haftungsausschluss
Die Informationen und Veröffentlichungen sind nicht als Finanz-, Anlage-, Handels- oder andere Arten von Ratschlägen oder Empfehlungen gedacht, die von TradingView bereitgestellt oder gebilligt werden, und stellen diese nicht dar. Lesen Sie mehr in den Nutzungsbedingungen.