
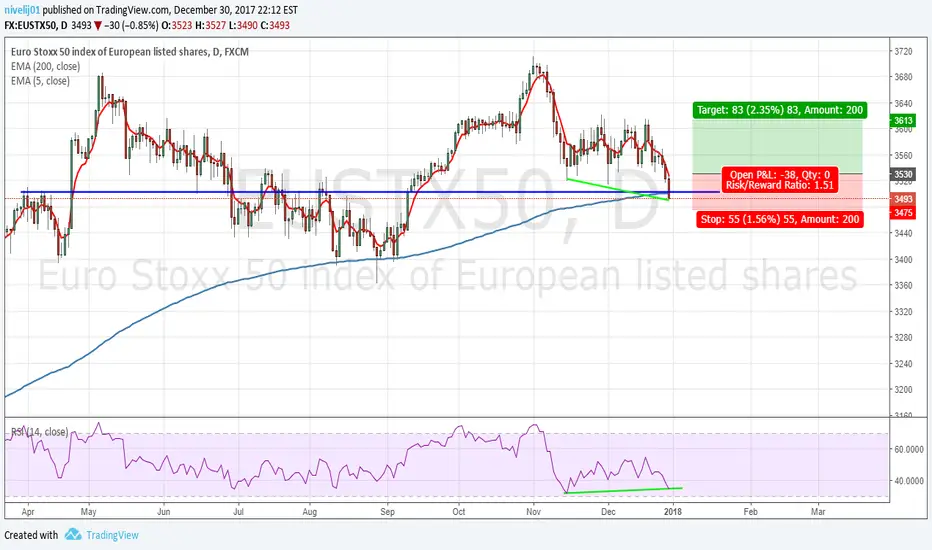
I can see a potential Long setup for EUSTX50 index. Couple of things that I observed:
1. Price is currently retesting EMA(200) and this is also a resistance-turned-support zone (back in April 2017).
2. A divergence observed between the chart and RSI(14), as chart is making lower low, whereas RSI(14) is making higher low.
If price can close around 3530 (which I roughly calculate should be when it close above EMA(50)), then I may open a Long position. Otherwise, no trade on this index.
1. Price is currently retesting EMA(200) and this is also a resistance-turned-support zone (back in April 2017).
2. A divergence observed between the chart and RSI(14), as chart is making lower low, whereas RSI(14) is making higher low.
If price can close around 3530 (which I roughly calculate should be when it close above EMA(50)), then I may open a Long position. Otherwise, no trade on this index.
Anmerkung
Typo, it's EMA(5), not EMA(50)Trade wurde manuell geschlossen
Closed the trade with profit for now.
Haftungsausschluss
Die Informationen und Veröffentlichungen sind nicht als Finanz-, Anlage-, Handels- oder andere Arten von Ratschlägen oder Empfehlungen gedacht, die von TradingView bereitgestellt oder gebilligt werden, und stellen diese nicht dar. Lesen Sie mehr in den Nutzungsbedingungen.
Haftungsausschluss
Die Informationen und Veröffentlichungen sind nicht als Finanz-, Anlage-, Handels- oder andere Arten von Ratschlägen oder Empfehlungen gedacht, die von TradingView bereitgestellt oder gebilligt werden, und stellen diese nicht dar. Lesen Sie mehr in den Nutzungsbedingungen.