
📍 What I'm Seeing (Technical Context)
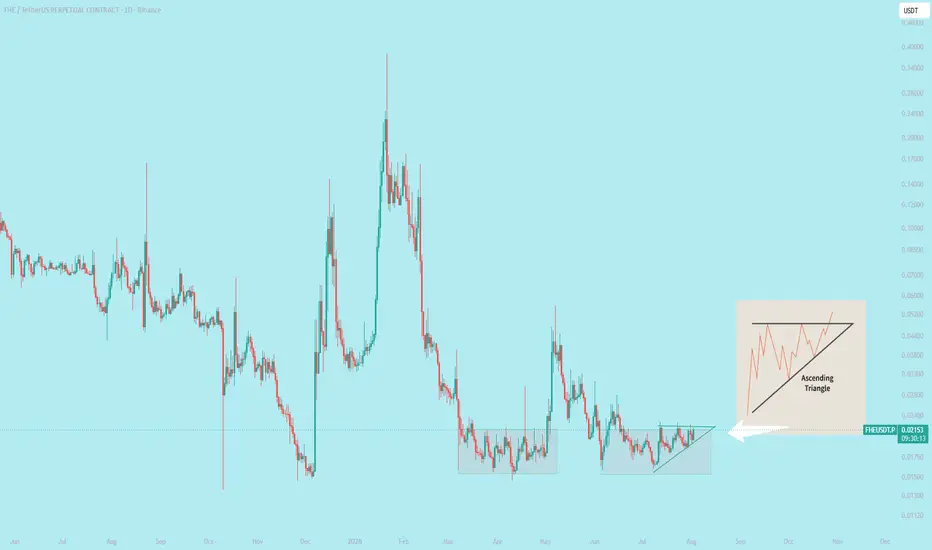
- Market Structure: FHE/USDT (1D Timeframe) has completed a prolonged downside phase and is now forming a clear accumulation base near historical lows.
- Pattern: An Ascending Triangle pattern is actively developing, characterized by consistent higher lows pressing against a solid horizontal resistance zone around 0.02300 - 0.02400.
- Price Action: Buyers are building momentum, pushing price higher into the resistance block with narrowing volatility.
💡 Why It Matters (Confluence & Setup)
- Accumulation & Squeeze: The continuous higher-low structure indicates strong buying demand, gradually weakening the sellers at the upper boundary.
- High R:R Opportunity: A breakout from this multi-week accumulation zone offers a high probability expansion toward upper key liquidity levels.
🎯 What I Expect Next (Execution Plan)
- Breakout Trigger: A clean Daily candle close above 0.02400 confirms the pattern breakout.
- Invalidation (SL): Daily close below the ascending trendline support at 0.01750.
- Targets (TPs):
• TP 1: 0.03300 - 0.03800 (Mid-term Resistance)
• TP 2: 0.04400 - 0.05200 (Key Liquidity Pool)
• TP 3: 0.07000+ (HTF Expansion Target)
Trade ist aktiv
🚀  FHE UPDATE: +12% RUNNING PROFIT!
The breakout momentum is holding strong!

Haftungsausschluss
Die Informationen und Veröffentlichungen sind nicht als Finanz-, Anlage-, Handels- oder andere Arten von Ratschlägen oder Empfehlungen gedacht, die von TradingView bereitgestellt oder gebilligt werden, und stellen diese nicht dar. Lesen Sie mehr in den Nutzungsbedingungen.
Haftungsausschluss
Die Informationen und Veröffentlichungen sind nicht als Finanz-, Anlage-, Handels- oder andere Arten von Ratschlägen oder Empfehlungen gedacht, die von TradingView bereitgestellt oder gebilligt werden, und stellen diese nicht dar. Lesen Sie mehr in den Nutzungsbedingungen.