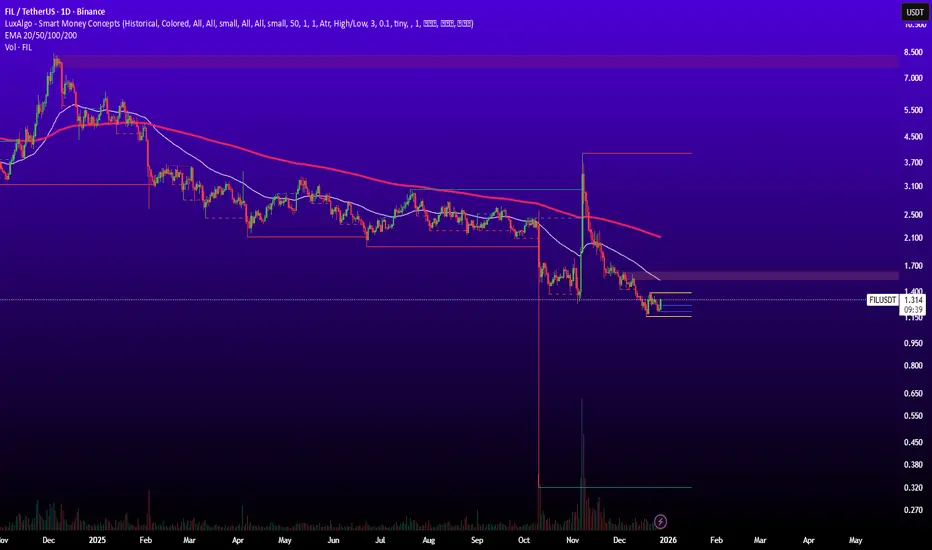
The daily chart of 
 FILUSDT shows an overall bearish structure, but weakening selling pressure and price consolidation suggest that downside momentum is fading at current levels.
Price is moving inside a lower-range trading zone, and a breakout above the range high could be the first sign of a bearish trend correction.
FILUSDT shows an overall bearish structure, but weakening selling pressure and price consolidation suggest that downside momentum is fading at current levels.Price is moving inside a lower-range trading zone, and a breakout above the range high could be the first sign of a bearish trend correction.
- Supports:
- 1.150
- Resistances:
- 1.311
- 1.600 to 1.700
- 2.100
- 2.500

Verbundene Veröffentlichungen
Haftungsausschluss
Die Informationen und Veröffentlichungen sind nicht als Finanz-, Anlage-, Handels- oder andere Arten von Ratschlägen oder Empfehlungen gedacht, die von TradingView bereitgestellt oder gebilligt werden, und stellen diese nicht dar. Lesen Sie mehr in den Nutzungsbedingungen.
Haftungsausschluss
Die Informationen und Veröffentlichungen sind nicht als Finanz-, Anlage-, Handels- oder andere Arten von Ratschlägen oder Empfehlungen gedacht, die von TradingView bereitgestellt oder gebilligt werden, und stellen diese nicht dar. Lesen Sie mehr in den Nutzungsbedingungen.