
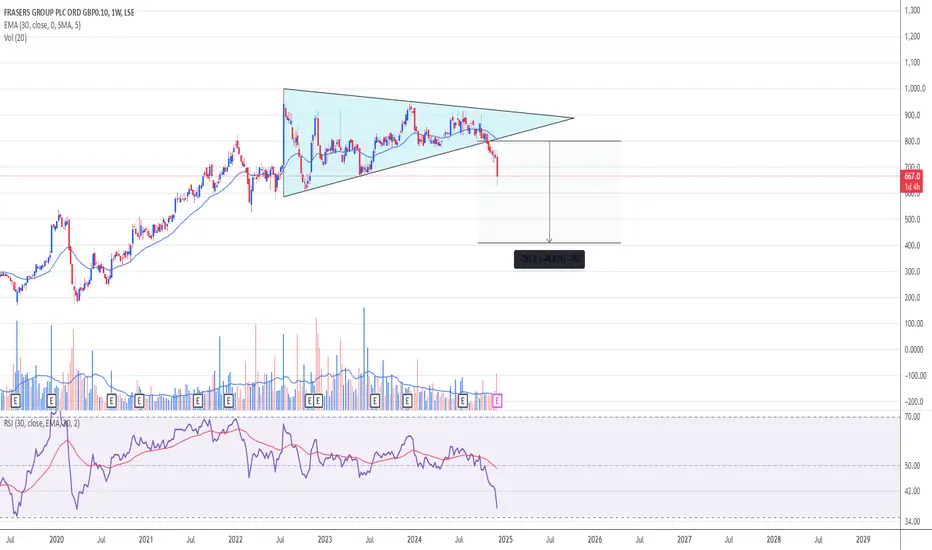
From the bottom of the pandemic they went from 180 to 995.
In Oct 24 they broke to the downside after forming a triangle pattern from July 22 to Oct 24.
There was no indication that the price would break out to the upside from that pattern.
In technical analysis, the target for Shorters would be 409.
GLA and DYOR. This is not a solicitation to hold or trade.
In Oct 24 they broke to the downside after forming a triangle pattern from July 22 to Oct 24.
There was no indication that the price would break out to the upside from that pattern.
In technical analysis, the target for Shorters would be 409.
GLA and DYOR. This is not a solicitation to hold or trade.

Haftungsausschluss
Die Informationen und Veröffentlichungen sind nicht als Finanz-, Anlage-, Handels- oder andere Arten von Ratschlägen oder Empfehlungen gedacht, die von TradingView bereitgestellt oder gebilligt werden, und stellen diese nicht dar. Lesen Sie mehr in den Nutzungsbedingungen.
Haftungsausschluss
Die Informationen und Veröffentlichungen sind nicht als Finanz-, Anlage-, Handels- oder andere Arten von Ratschlägen oder Empfehlungen gedacht, die von TradingView bereitgestellt oder gebilligt werden, und stellen diese nicht dar. Lesen Sie mehr in den Nutzungsbedingungen.