
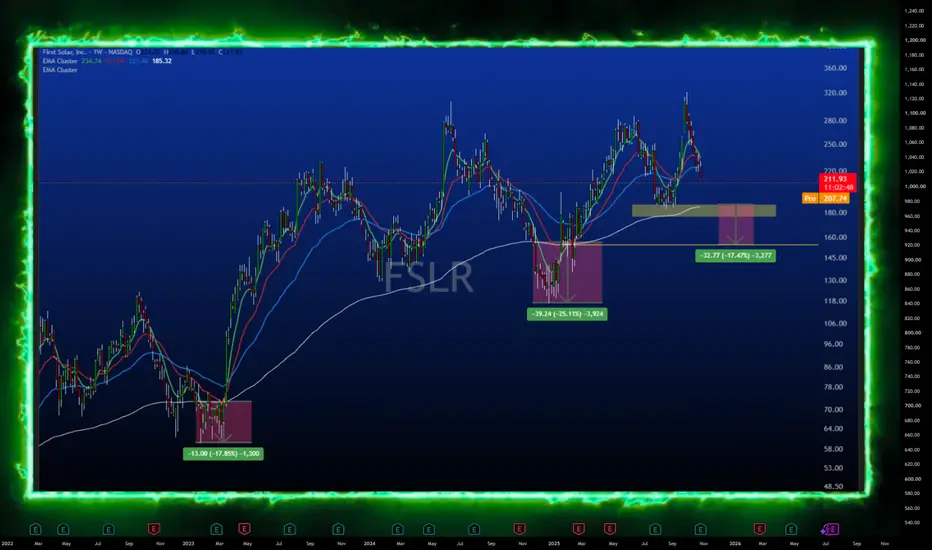
FSLR is trading near $185, sitting 0.9x weekly ATR from its 200-week EMA. That distance places it inside the defined buy zone (≤1x ATR from the 200W EMA), well short of extended (≤4x). The 200-week EMA is up 31% over the last two years and still rising, with the 50-week EMA above it.
Gate 1, trend A rising 200W EMA with price pulled back to touch it, not through it, and the 50W holding above the 200W, is the structural definition of an intact long-term uptrend resting at support rather than breaking down. That's the first gate, and it's confirmed here.
Gate 2, momentum Confirm momentum is turning up from this level rather than still falling before treating this as a live entry. On a name this volatile a pullback to trend support is not the same as a base already forming. Wait for the weekly candle to show the reset resolving before sizing in.
Gate 3, risk Entry zone: near $185. Scale-out targets, scaled to this asset's own ATR: TP1 → $327 (+76%) TP2 → $468 (+152%) TP3 → $694 (+274%)
Volatility context: 14-day ATR is $11.44, average daily range $10.67, an expected day of roughly ±$11.44, around 6% of price. This is a genuine mover, which is both the source of the wide upside targets and the reason position size matters more here than on a slow name. A 1.5x ATR stop from entry is roughly $17.16 of room. No trailing stop until price reclaims and holds above the 50-week EMA, tightening risk before the trend has actually resumed just invites noise-driven stop-outs on a stock that swings this hard.
The seasonality overlay Kept in perspective, because this is a mild tailwind rather than the headline. Averaged over the last five years, FSLR has closed green in 7 of its 12 calendar months with a positive average monthly return of +2.65%. The strongest month has historically been May and the weakest June, both now behind us, so the seasonally worst stretch of the year has already passed. The structure is the reason this is on the chart. The calendar simply isn't working against it.
Build in stages rather than one entry. No leverage, and size it for the volatility. Assess Gate 1 first, then Gate 2, then size Gate 3 off current ATR, not a static stop distance.
Not financial advice. All commentary is for analytical purposes only.
Gate 1, trend A rising 200W EMA with price pulled back to touch it, not through it, and the 50W holding above the 200W, is the structural definition of an intact long-term uptrend resting at support rather than breaking down. That's the first gate, and it's confirmed here.
Gate 2, momentum Confirm momentum is turning up from this level rather than still falling before treating this as a live entry. On a name this volatile a pullback to trend support is not the same as a base already forming. Wait for the weekly candle to show the reset resolving before sizing in.
Gate 3, risk Entry zone: near $185. Scale-out targets, scaled to this asset's own ATR: TP1 → $327 (+76%) TP2 → $468 (+152%) TP3 → $694 (+274%)
Volatility context: 14-day ATR is $11.44, average daily range $10.67, an expected day of roughly ±$11.44, around 6% of price. This is a genuine mover, which is both the source of the wide upside targets and the reason position size matters more here than on a slow name. A 1.5x ATR stop from entry is roughly $17.16 of room. No trailing stop until price reclaims and holds above the 50-week EMA, tightening risk before the trend has actually resumed just invites noise-driven stop-outs on a stock that swings this hard.
The seasonality overlay Kept in perspective, because this is a mild tailwind rather than the headline. Averaged over the last five years, FSLR has closed green in 7 of its 12 calendar months with a positive average monthly return of +2.65%. The strongest month has historically been May and the weakest June, both now behind us, so the seasonally worst stretch of the year has already passed. The structure is the reason this is on the chart. The calendar simply isn't working against it.
Build in stages rather than one entry. No leverage, and size it for the volatility. Assess Gate 1 first, then Gate 2, then size Gate 3 off current ATR, not a static stop distance.
Not financial advice. All commentary is for analytical purposes only.

⭐ Follow the 3-Gate System - tradedesk.rbtrading.site
⭐ Prop Firm Deals - linktr.ee/rb_tradingltd
⭐ #1 Free Trading Journal Lite | +20% Off Pro code RBT20 - rbtrading.site/?ref=RBT20
⭐ Prop Firm Deals - linktr.ee/rb_tradingltd
⭐ #1 Free Trading Journal Lite | +20% Off Pro code RBT20 - rbtrading.site/?ref=RBT20
Haftungsausschluss
Die Informationen und Veröffentlichungen sind nicht als Finanz-, Anlage-, Handels- oder andere Arten von Ratschlägen oder Empfehlungen gedacht, die von TradingView bereitgestellt oder gebilligt werden, und stellen diese nicht dar. Lesen Sie mehr in den Nutzungsbedingungen.
⭐ Follow the 3-Gate System - tradedesk.rbtrading.site
⭐ Prop Firm Deals - linktr.ee/rb_tradingltd
⭐ #1 Free Trading Journal Lite | +20% Off Pro code RBT20 - rbtrading.site/?ref=RBT20
⭐ Prop Firm Deals - linktr.ee/rb_tradingltd
⭐ #1 Free Trading Journal Lite | +20% Off Pro code RBT20 - rbtrading.site/?ref=RBT20
Haftungsausschluss
Die Informationen und Veröffentlichungen sind nicht als Finanz-, Anlage-, Handels- oder andere Arten von Ratschlägen oder Empfehlungen gedacht, die von TradingView bereitgestellt oder gebilligt werden, und stellen diese nicht dar. Lesen Sie mehr in den Nutzungsbedingungen.