Long
FSLY in a Bullish Wedge?
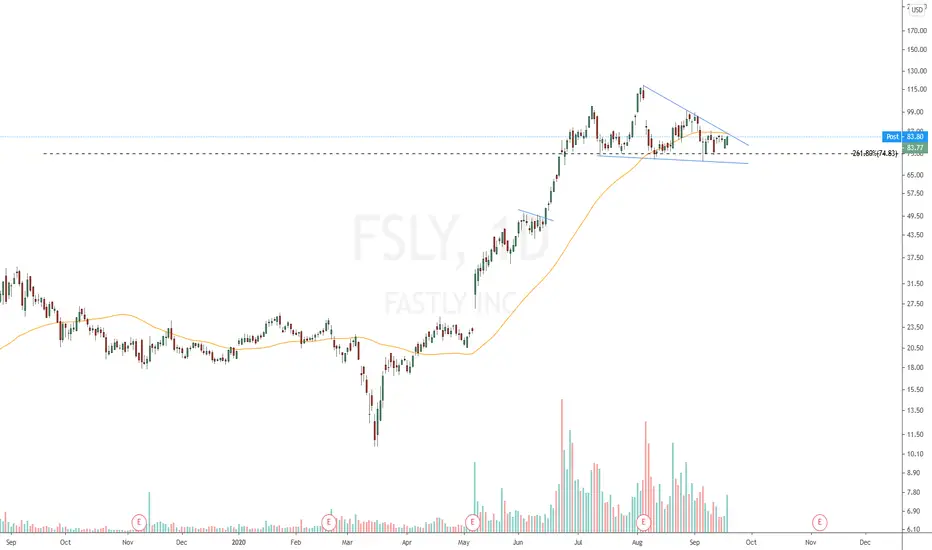
I had been thinking that FSLY was forming a head and shoulders top - but I've come around to interpreting it as a bullish wedge after this weeks action. It continues to find support at a key level. It also printed a shakeout candle (reversal) on 09/04 after breaking to new lows. Breaking out from the wedge would also be a break of the 50-day moving average. Taking out the "right shoulder" would likely propel this thing to new all-time highs. Price action this week has steady despite the tech selloff. I think there's a lot to like about this FSLY chart. Maybe next week?

Haftungsausschluss
Die Informationen und Veröffentlichungen sind nicht als Finanz-, Anlage-, Handels- oder andere Arten von Ratschlägen oder Empfehlungen gedacht, die von TradingView bereitgestellt oder gebilligt werden, und stellen diese nicht dar. Lesen Sie mehr in den Nutzungsbedingungen.
Haftungsausschluss
Die Informationen und Veröffentlichungen sind nicht als Finanz-, Anlage-, Handels- oder andere Arten von Ratschlägen oder Empfehlungen gedacht, die von TradingView bereitgestellt oder gebilligt werden, und stellen diese nicht dar. Lesen Sie mehr in den Nutzungsbedingungen.