Long
Can FSR move higher? LONG
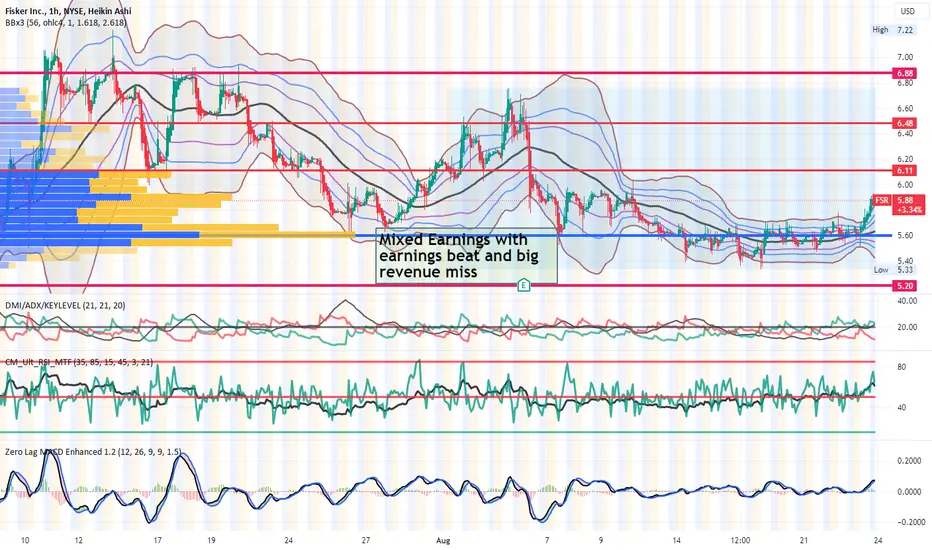
FSR on the one hour chart fell from a triple top in mid July into the lower range
of the volume profile's high volume area then bounced higher in a series of higher
highs but then rolled over and fell again/ It has consolidated sideways about
that POC line and now is above it. The indicators including Directional Index
Zero Lag MACD and dual time frame RSI all indicate a return to bullish momentum.
I will take a long trade the horizontal levels on the chart served as tiered targets
for a risk managed trade. I will take some call options contracts as well. I think FSR
may follow the market leader in TSLA for a bit.
Trade ist aktiv
Today is another add day.
Haftungsausschluss
Die Informationen und Veröffentlichungen sind nicht als Finanz-, Anlage-, Handels- oder andere Arten von Ratschlägen oder Empfehlungen gedacht, die von TradingView bereitgestellt oder gebilligt werden, und stellen diese nicht dar. Lesen Sie mehr in den Nutzungsbedingungen.
Haftungsausschluss
Die Informationen und Veröffentlichungen sind nicht als Finanz-, Anlage-, Handels- oder andere Arten von Ratschlägen oder Empfehlungen gedacht, die von TradingView bereitgestellt oder gebilligt werden, und stellen diese nicht dar. Lesen Sie mehr in den Nutzungsbedingungen.