
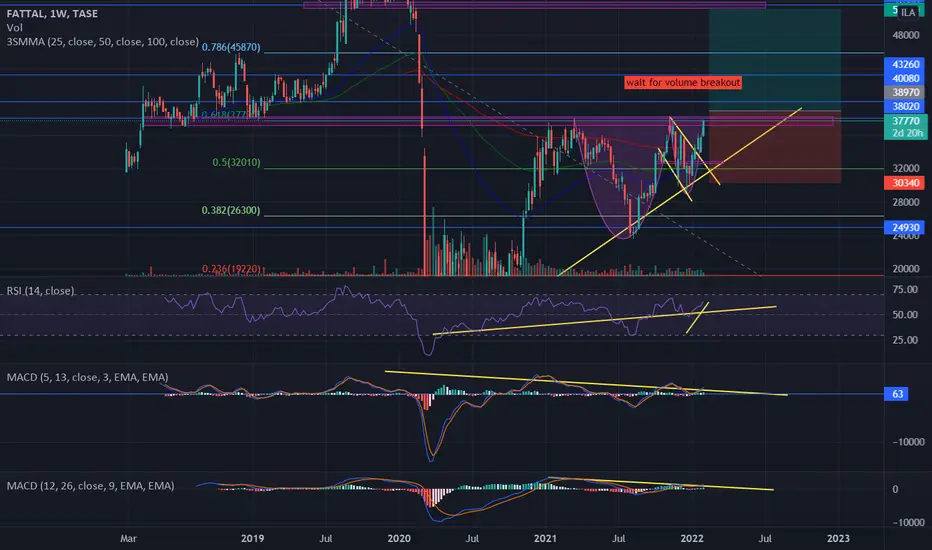
Perfect cup and handle.
waiting for the resistance and the 0.618 fib to break, and the weekly + monthly candlsticks close above resistance.
50 ema in monthly chart will break now, after few rejects.
In weekly chart all ema failed to reject.
I estimate 30% growth to the next month:)
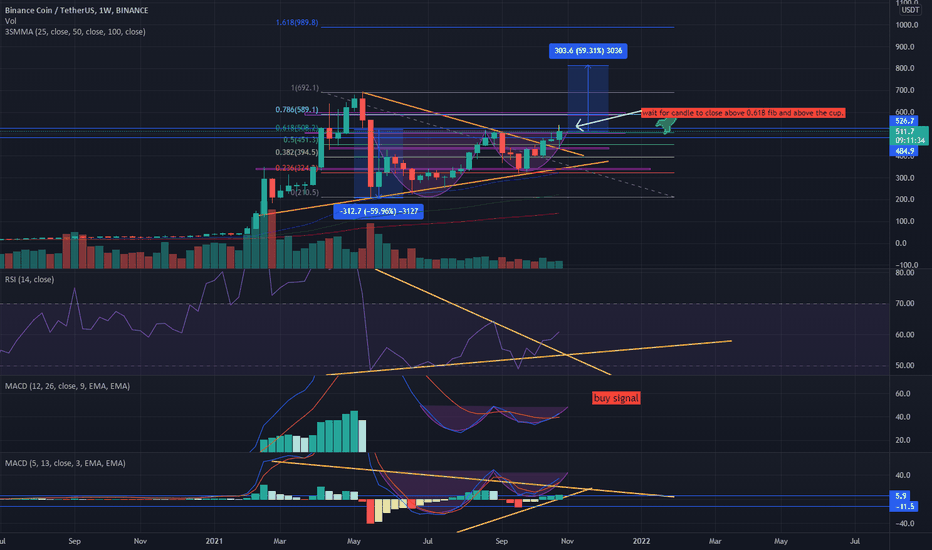
In the past I TA very similar BNBUSDT weekly chart and the growth wasn't late to come.
The chart:
FTAL monthly chart:

waiting for the resistance and the 0.618 fib to break, and the weekly + monthly candlsticks close above resistance.
50 ema in monthly chart will break now, after few rejects.
In weekly chart all ema failed to reject.
I estimate 30% growth to the next month:)
In the past I TA very similar BNBUSDT weekly chart and the growth wasn't late to come.
The chart:
FTAL monthly chart:

Verbundene Veröffentlichungen
Haftungsausschluss
Die Informationen und Veröffentlichungen sind nicht als Finanz-, Anlage-, Handels- oder andere Arten von Ratschlägen oder Empfehlungen gedacht, die von TradingView bereitgestellt oder gebilligt werden, und stellen diese nicht dar. Lesen Sie mehr in den Nutzungsbedingungen.
Verbundene Veröffentlichungen
Haftungsausschluss
Die Informationen und Veröffentlichungen sind nicht als Finanz-, Anlage-, Handels- oder andere Arten von Ratschlägen oder Empfehlungen gedacht, die von TradingView bereitgestellt oder gebilligt werden, und stellen diese nicht dar. Lesen Sie mehr in den Nutzungsbedingungen.