
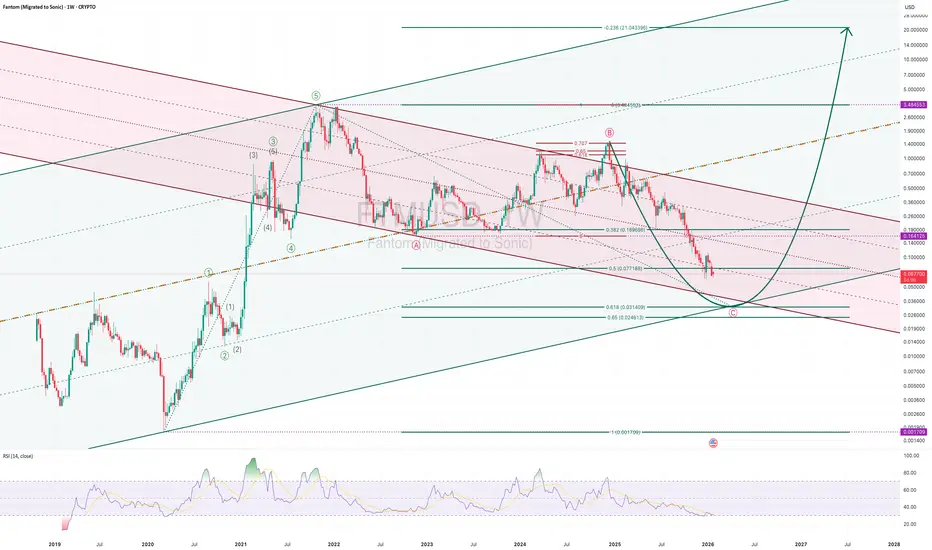
FTM – Weekly Structure Overview
Price completed a clear 5-wave impulse from the 2020 low into the 2021/22 peak. Since then, the market has been unfolding a higher-degree A–B–C correction within a descending channel.
Wave B stalled in the typical 0.618–0.707 Fibonacci retracement zone, followed by an impulsive decline forming Wave C. The current selloff remains technically corrective and is approaching a strong confluence support area between the 0.5–0.618 retracements, aligned with long-term channel support.
Structure suggests late-stage correction, not trend failure.
A completed Wave C would open the door for a new primary impulsive cycle.
[u]Key Takeaways:[/u]
• Macro trend remains structurally intact
• Current price action appears to be late-stage corrective behavior
• No bullish confirmation yet — but downside risk is approaching exhaustion levels
• Patience is required until Wave C completes and structure confirms
Like and follow for more charts like this.
Price completed a clear 5-wave impulse from the 2020 low into the 2021/22 peak. Since then, the market has been unfolding a higher-degree A–B–C correction within a descending channel.
Wave B stalled in the typical 0.618–0.707 Fibonacci retracement zone, followed by an impulsive decline forming Wave C. The current selloff remains technically corrective and is approaching a strong confluence support area between the 0.5–0.618 retracements, aligned with long-term channel support.
Structure suggests late-stage correction, not trend failure.
A completed Wave C would open the door for a new primary impulsive cycle.
[u]Key Takeaways:[/u]
• Macro trend remains structurally intact
• Current price action appears to be late-stage corrective behavior
• No bullish confirmation yet — but downside risk is approaching exhaustion levels
• Patience is required until Wave C completes and structure confirms
Like and follow for more charts like this.
Anmerkung
Wave 4 trading process riding Wave 5 of ((C))Trade ist aktiv
Anmerkung

In technical analysis, several methods focus on higher timeframes to provide a broader, more reliable context for trading or investment decisions. Elliott Wave Principle generally considers historical higher timeframes as mandatory.
Haftungsausschluss
Die Informationen und Veröffentlichungen sind nicht als Finanz-, Anlage-, Handels- oder andere Arten von Ratschlägen oder Empfehlungen gedacht, die von TradingView bereitgestellt oder gebilligt werden, und stellen diese nicht dar. Lesen Sie mehr in den Nutzungsbedingungen.
In technical analysis, several methods focus on higher timeframes to provide a broader, more reliable context for trading or investment decisions. Elliott Wave Principle generally considers historical higher timeframes as mandatory.
Haftungsausschluss
Die Informationen und Veröffentlichungen sind nicht als Finanz-, Anlage-, Handels- oder andere Arten von Ratschlägen oder Empfehlungen gedacht, die von TradingView bereitgestellt oder gebilligt werden, und stellen diese nicht dar. Lesen Sie mehr in den Nutzungsbedingungen.