Long
FTM reverse head and shoulders
#FTM/USDT
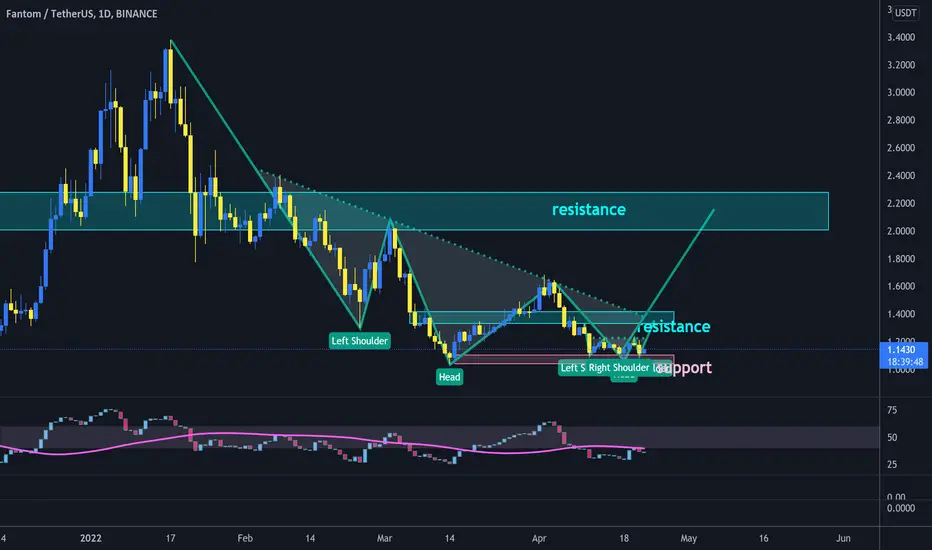
 FTM shaped an inverse head and shoulders pattern in daily time frame and we can see its fractal in right shoulder is another inverted head and shoulders in 4h time frame.
🐮 holding the support zone will increase price to neck line and then resistance zone around $1.4 to complete the 4h H&S.
🐮🐮 neck line of daily H&S is at target of 4h one so break out from this resistance will head up price to resistance zone between $2 and $2.3 to complete daily H&S.
🐻 break down from support zone will invalid this scenario.

FTM shaped an inverse head and shoulders pattern in daily time frame and we can see its fractal in right shoulder is another inverted head and shoulders in 4h time frame.🐮 holding the support zone will increase price to neck line and then resistance zone around $1.4 to complete the 4h H&S.
🐮🐮 neck line of daily H&S is at target of 4h one so break out from this resistance will head up price to resistance zone between $2 and $2.3 to complete daily H&S.
🐻 break down from support zone will invalid this scenario.

Verbundene Veröffentlichungen
Haftungsausschluss
Die Informationen und Veröffentlichungen sind nicht als Finanz-, Anlage-, Handels- oder andere Arten von Ratschlägen oder Empfehlungen gedacht, die von TradingView bereitgestellt oder gebilligt werden, und stellen diese nicht dar. Lesen Sie mehr in den Nutzungsbedingungen.
Verbundene Veröffentlichungen
Haftungsausschluss
Die Informationen und Veröffentlichungen sind nicht als Finanz-, Anlage-, Handels- oder andere Arten von Ratschlägen oder Empfehlungen gedacht, die von TradingView bereitgestellt oder gebilligt werden, und stellen diese nicht dar. Lesen Sie mehr in den Nutzungsbedingungen.