FTM
Hi,
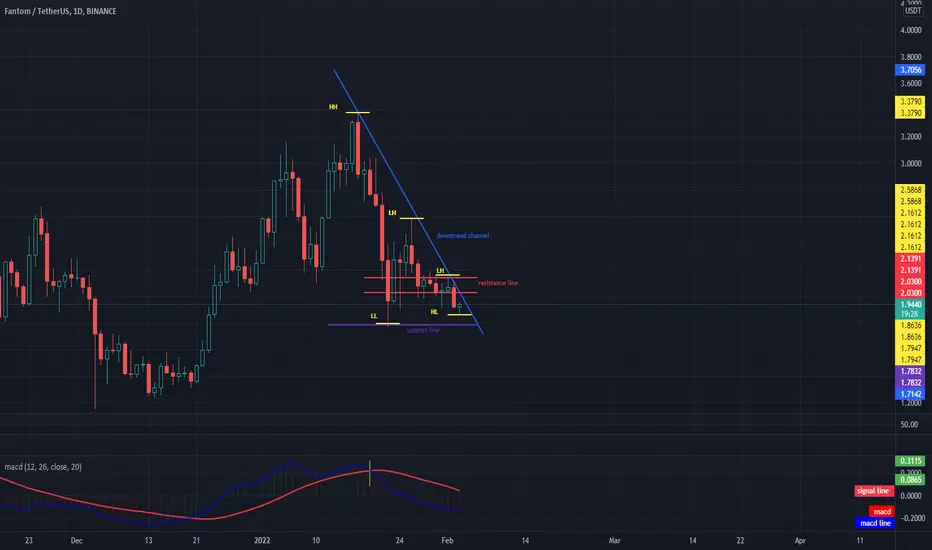
Looking at the FTM / USDT chart, you can see that we are on the uptrend line, while the pattern formed of lower and lower highs and lows indicates a downward trend. Currently, price needs to break a low at $ 2.1612 for a potential trend to reverse. The current support is at $ 1.7832 and the first resistance is at $ 2.03.
Looking at the FTM / USDT chart, you can see that we are on the uptrend line, while the pattern formed of lower and lower highs and lows indicates a downward trend. Currently, price needs to break a low at $ 2.1612 for a potential trend to reverse. The current support is at $ 1.7832 and the first resistance is at $ 2.03.

Haftungsausschluss
Die Informationen und Veröffentlichungen sind nicht als Finanz-, Anlage-, Handels- oder andere Arten von Ratschlägen oder Empfehlungen gedacht, die von TradingView bereitgestellt oder gebilligt werden, und stellen diese nicht dar. Lesen Sie mehr in den Nutzungsbedingungen.
Haftungsausschluss
Die Informationen und Veröffentlichungen sind nicht als Finanz-, Anlage-, Handels- oder andere Arten von Ratschlägen oder Empfehlungen gedacht, die von TradingView bereitgestellt oder gebilligt werden, und stellen diese nicht dar. Lesen Sie mehr in den Nutzungsbedingungen.