

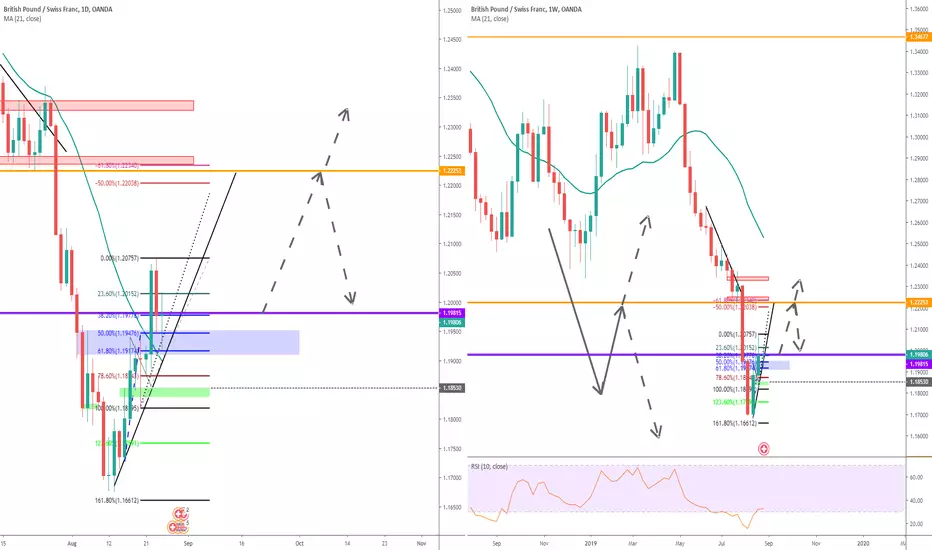
For starters, on the right we have a weekly chart, and on the left we have a daily chart. Using multi time frame analysis, I'm leaning towards believing that this current uptrend we are in can make it all the way to the orange line for either a retest of that orange MONTHLY zone as a support turned resistance OR, it will turn out to be a false breakout on the monthly chart, and break back into the consolidation between the two orange bars on my weekly chart to the right. Either way, it's looking like longs to me until we get to that orange zone. Especially after we see a retest of the purple weekly zone on the daily chart(left) with convergence of retesting to the 61.8% zone, and further convergence of what I had pegged as a supply zone, but I'm not good with those yet so you decide for yourself. I would say this is a good trade to lose, and as you all should know, anything can happen anytime so best of luck.
I am not a professional trader and this is not professional advice, (maybe one day it will be), but until then, trade at your own risk!
#PatiencePays
I am not a professional trader and this is not professional advice, (maybe one day it will be), but until then, trade at your own risk!
#PatiencePays

Haftungsausschluss
Die Informationen und Veröffentlichungen sind nicht als Finanz-, Anlage-, Handels- oder andere Arten von Ratschlägen oder Empfehlungen gedacht, die von TradingView bereitgestellt oder gebilligt werden, und stellen diese nicht dar. Lesen Sie mehr in den Nutzungsbedingungen.
Haftungsausschluss
Die Informationen und Veröffentlichungen sind nicht als Finanz-, Anlage-, Handels- oder andere Arten von Ratschlägen oder Empfehlungen gedacht, die von TradingView bereitgestellt oder gebilligt werden, und stellen diese nicht dar. Lesen Sie mehr in den Nutzungsbedingungen.