

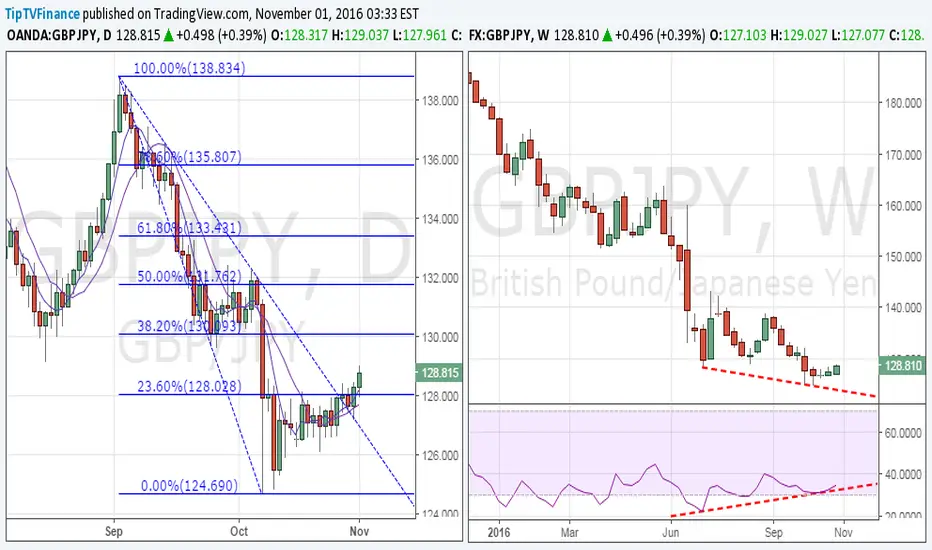
Daily/Weekly chart
· The pair finally closed above 128.03 (23.6% Fibo of Sept high and Oct low) after having repeated failed to do so last month. Also note the bullish 5-DMA and 10-DMA crossover.
· On the weekly chart, we have a bullish price RSI divergence. Consequently, the cross looks poised for a rise to 130.10 (38.2% Fibo).
· On the other hand, only a daily close below 127.19 (previous day’s low) would signal bullish invalidation.
· The pair finally closed above 128.03 (23.6% Fibo of Sept high and Oct low) after having repeated failed to do so last month. Also note the bullish 5-DMA and 10-DMA crossover.
· On the weekly chart, we have a bullish price RSI divergence. Consequently, the cross looks poised for a rise to 130.10 (38.2% Fibo).
· On the other hand, only a daily close below 127.19 (previous day’s low) would signal bullish invalidation.

Haftungsausschluss
Die Informationen und Veröffentlichungen sind nicht als Finanz-, Anlage-, Handels- oder andere Arten von Ratschlägen oder Empfehlungen gedacht, die von TradingView bereitgestellt oder gebilligt werden, und stellen diese nicht dar. Lesen Sie mehr in den Nutzungsbedingungen.
Haftungsausschluss
Die Informationen und Veröffentlichungen sind nicht als Finanz-, Anlage-, Handels- oder andere Arten von Ratschlägen oder Empfehlungen gedacht, die von TradingView bereitgestellt oder gebilligt werden, und stellen diese nicht dar. Lesen Sie mehr in den Nutzungsbedingungen.