

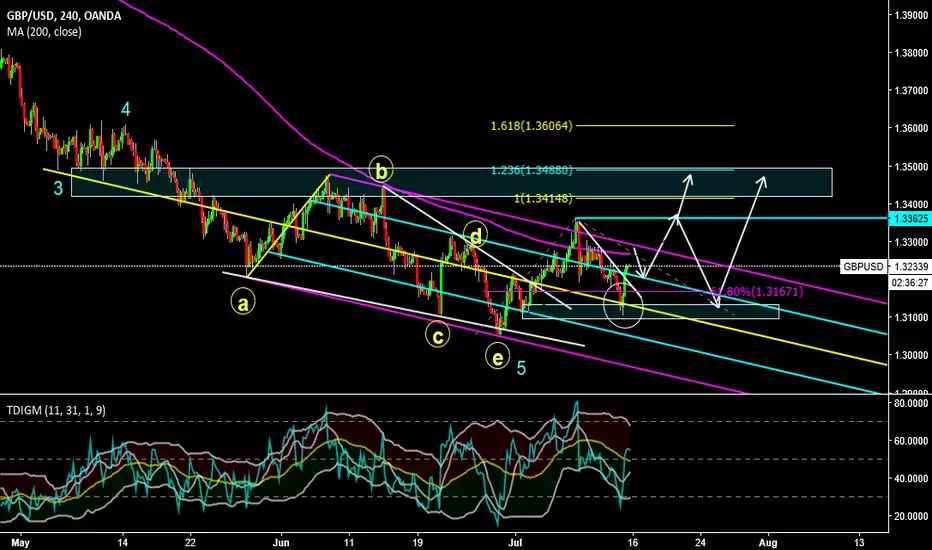
So basically, the way I have it drawn up as it did a 5 wave from the top, wave 5 being in the form of an ending diagonal. So, at this point, I would watch that 200 on 4hr to possibly give a buy setup in the form of flag. I circled where buy should have been from. I don't really feel like we can predict exact structure considering where we are at, but I drew up what I see as potential pattern. I consider it to be a buy setup and would think it would test that zone at least with a possibility of making some kind of flat pattern. Safest thing... Watch the 200 on 4hr, see if you get a smaller correction there. It can just break out, but watch out for a larger W-X-Y pattern to form. (That's the flat scenario I am showing). It's bout strategy.

Haftungsausschluss
Die Informationen und Veröffentlichungen sind nicht als Finanz-, Anlage-, Handels- oder andere Arten von Ratschlägen oder Empfehlungen gedacht, die von TradingView bereitgestellt oder gebilligt werden, und stellen diese nicht dar. Lesen Sie mehr in den Nutzungsbedingungen.
Haftungsausschluss
Die Informationen und Veröffentlichungen sind nicht als Finanz-, Anlage-, Handels- oder andere Arten von Ratschlägen oder Empfehlungen gedacht, die von TradingView bereitgestellt oder gebilligt werden, und stellen diese nicht dar. Lesen Sie mehr in den Nutzungsbedingungen.