

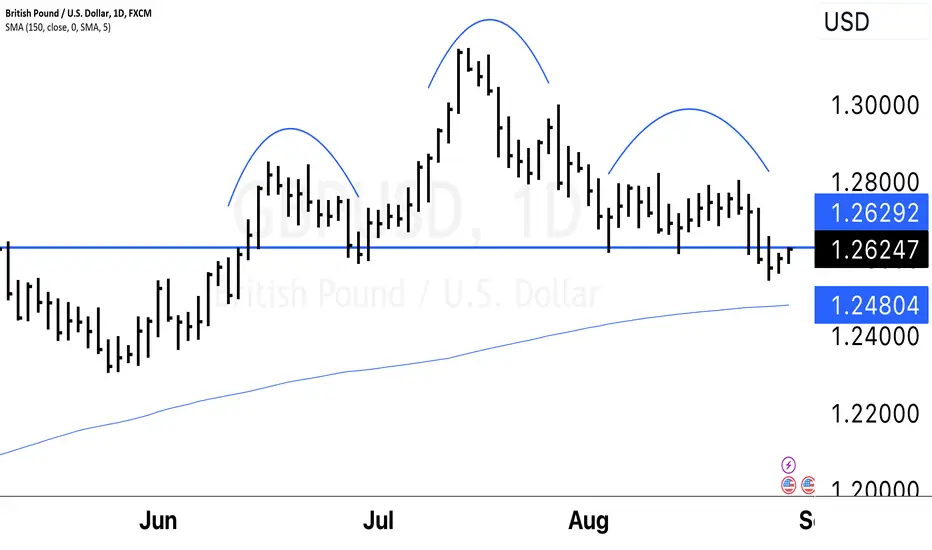
$GBDUSD Head And Shoulders Pattern, The Head and Shoulders pattern is a well-known technical analysis pattern that typically indicates a reversal in a prevailing trend. It is characterized by three distinct peaks or troughs – a higher peak (head) flanked by two lower peaks (shoulders) on each side. This pattern is commonly observed after an uptrend and suggests a potential shift from bullish to bearish sentiment.
The formation of the Head and Shoulders pattern consists of the following key components:
1. **Left Shoulder:** The initial peak in the pattern forms as the price moves higher, representing a continuation of the existing trend.
2. **Head:** The highest peak among the three, the head, forms as the price advances further. It signifies a last attempt by buyers to sustain the uptrend. At this point, bullish momentum weakens.
3. **Right Shoulder:** The third peak, similar to the left shoulder, is lower than the head. It indicates a struggle between buyers and sellers and often comes with decreased trading volume.
The significance of the pattern lies in the neckline – a trendline drawn through the lows between the left shoulder and the head, and the head and the right shoulder. The neckline acts as a support level, and a breach of this level is seen as a confirmation of the pattern. Once the neckline is broken, the pattern is considered complete.
Here's how traders often interpret the pattern:
- **Confirmation:** A valid breakout below the neckline after the formation of the right shoulder signals a potential trend reversal. This is the point at which traders might consider opening short positions.
- **Price Target:** The expected price decline after the breakout is roughly estimated by measuring the vertical distance from the head to the neckline. This measurement is then projected downward from the neckline breakout point.
- **Volume Consideration:** Volume can play a crucial role in confirming the pattern. Typically, volume tends to decrease as the pattern forms and then increases when the neckline is broken, indicating strong selling pressure.
- **Failed Patterns:** Not every Head and Shoulders pattern results in a reversal. Sometimes, the neckline is tested but not broken, leading to a continuation of the original trend.
- **Inverted Head and Shoulders:** Conversely, an inverted version of this pattern can occur after a downtrend, indicating a potential bullish reversal.
Traders often use additional indicators, such as momentum oscillators and volume analysis, to confirm the potential reversal signaled by the Head and Shoulders pattern. Like all technical patterns, it's important to remember that no pattern guarantees a particular outcome, and successful trading requires a combination of analysis, risk management, and adaptability to changing market conditions.
The formation of the Head and Shoulders pattern consists of the following key components:
1. **Left Shoulder:** The initial peak in the pattern forms as the price moves higher, representing a continuation of the existing trend.
2. **Head:** The highest peak among the three, the head, forms as the price advances further. It signifies a last attempt by buyers to sustain the uptrend. At this point, bullish momentum weakens.
3. **Right Shoulder:** The third peak, similar to the left shoulder, is lower than the head. It indicates a struggle between buyers and sellers and often comes with decreased trading volume.
The significance of the pattern lies in the neckline – a trendline drawn through the lows between the left shoulder and the head, and the head and the right shoulder. The neckline acts as a support level, and a breach of this level is seen as a confirmation of the pattern. Once the neckline is broken, the pattern is considered complete.
Here's how traders often interpret the pattern:
- **Confirmation:** A valid breakout below the neckline after the formation of the right shoulder signals a potential trend reversal. This is the point at which traders might consider opening short positions.
- **Price Target:** The expected price decline after the breakout is roughly estimated by measuring the vertical distance from the head to the neckline. This measurement is then projected downward from the neckline breakout point.
- **Volume Consideration:** Volume can play a crucial role in confirming the pattern. Typically, volume tends to decrease as the pattern forms and then increases when the neckline is broken, indicating strong selling pressure.
- **Failed Patterns:** Not every Head and Shoulders pattern results in a reversal. Sometimes, the neckline is tested but not broken, leading to a continuation of the original trend.
- **Inverted Head and Shoulders:** Conversely, an inverted version of this pattern can occur after a downtrend, indicating a potential bullish reversal.
Traders often use additional indicators, such as momentum oscillators and volume analysis, to confirm the potential reversal signaled by the Head and Shoulders pattern. Like all technical patterns, it's important to remember that no pattern guarantees a particular outcome, and successful trading requires a combination of analysis, risk management, and adaptability to changing market conditions.

Haftungsausschluss
Die Informationen und Veröffentlichungen sind nicht als Finanz-, Anlage-, Handels- oder andere Arten von Ratschlägen oder Empfehlungen gedacht, die von TradingView bereitgestellt oder gebilligt werden, und stellen diese nicht dar. Lesen Sie mehr in den Nutzungsbedingungen.
Haftungsausschluss
Die Informationen und Veröffentlichungen sind nicht als Finanz-, Anlage-, Handels- oder andere Arten von Ratschlägen oder Empfehlungen gedacht, die von TradingView bereitgestellt oder gebilligt werden, und stellen diese nicht dar. Lesen Sie mehr in den Nutzungsbedingungen.