

hello dear trader📌 Why GBPUSD Inside a Diamond Pattern Stops Out Most Traders
📍 Timeframe: 15M
📍 Pair: GBPUSD
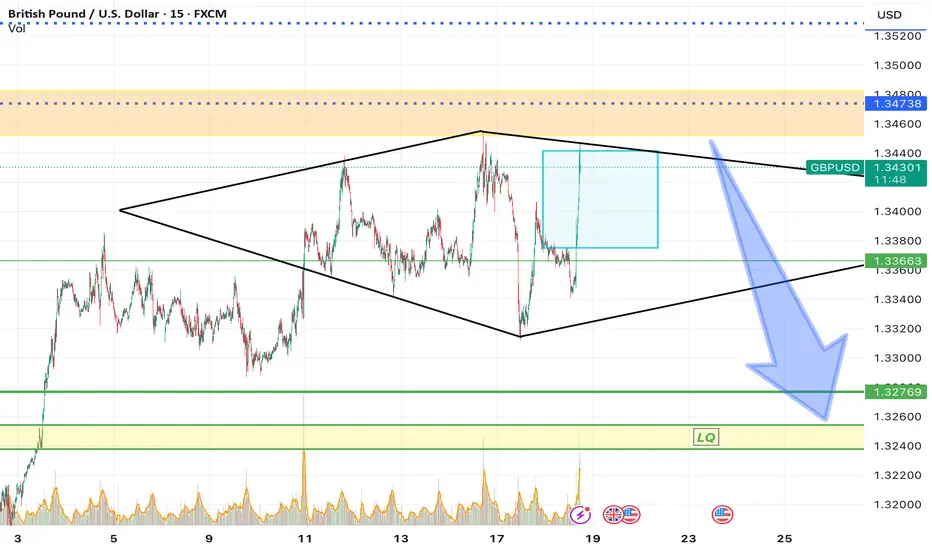
Price is currently trading inside a Diamond / Broadening Formation, which is not a trend environment, but a liquidity distribution phase.
1️⃣ What Does a Sharp Move Without Opposite Candles Mean?
The recent move from 1.3360 → 1.3440 was a fast 80–100 pip expansion with:
No meaningful pullbacks
No strong opposite candles
Continuous impulsive candles on M15
❗️This type of move:
Is not a healthy trend
Is usually a liquidity grab / stop-run
2️⃣ Why Do QM Setups Keep Failing Inside a Diamond?
Inside this structure:
HHs and LLs keep getting violated
BOS signals lose reliability
QM after QM gets invalidated
📌 This is not a strategy problem
📌 This is the nature of a non-directional market
Even professional traders typically take 3 to 7 consecutive stop-losses inside a Diamond structure.
3️⃣ If the Diamond Is Bearish, Why Did Price Rally?
Common misconception:
“The pattern is bearish, so price shouldn’t go up.”
Reality:
A Diamond is a distribution structure
It often starts with a fake upside expansion
The real move comes after liquidity is collected
The push into the premium zone around 1.3440 – 1.3470 was a classic buy-side liquidity sweep.
4️⃣ Using Fibonacci to Detect Trend Breakdown
In the recent legs:
Price repeatedly retraced into the 0.70 – 0.78 Fibonacci zone
But failed to continue impulsively
📌 This means:
❌ The trend is no longer healthy
✅ The market has transitioned into distribution / Diamond mode
5️⃣ Why You Should Not Trade Inside a Diamond
If you see:
Fake BOS signals
Repeated QM failures
Sharp moves in both directions
Constant rotation between premium & discount
⛔️ This is a wait-only environment, not an execution zone.
6️⃣ When Does the Real Target Activate?
Diamond height ≈ 140 pips
🎯 This target becomes valid only after:
A clean structural breakout
A confirmed pullback
Not while price is still inside the pattern
good luck
📍 Timeframe: 15M
📍 Pair: GBPUSD
Price is currently trading inside a Diamond / Broadening Formation, which is not a trend environment, but a liquidity distribution phase.
1️⃣ What Does a Sharp Move Without Opposite Candles Mean?
The recent move from 1.3360 → 1.3440 was a fast 80–100 pip expansion with:
No meaningful pullbacks
No strong opposite candles
Continuous impulsive candles on M15
❗️This type of move:
Is not a healthy trend
Is usually a liquidity grab / stop-run
2️⃣ Why Do QM Setups Keep Failing Inside a Diamond?
Inside this structure:
HHs and LLs keep getting violated
BOS signals lose reliability
QM after QM gets invalidated
📌 This is not a strategy problem
📌 This is the nature of a non-directional market
Even professional traders typically take 3 to 7 consecutive stop-losses inside a Diamond structure.
3️⃣ If the Diamond Is Bearish, Why Did Price Rally?
Common misconception:
“The pattern is bearish, so price shouldn’t go up.”
Reality:
A Diamond is a distribution structure
It often starts with a fake upside expansion
The real move comes after liquidity is collected
The push into the premium zone around 1.3440 – 1.3470 was a classic buy-side liquidity sweep.
4️⃣ Using Fibonacci to Detect Trend Breakdown
In the recent legs:
Price repeatedly retraced into the 0.70 – 0.78 Fibonacci zone
But failed to continue impulsively
📌 This means:
❌ The trend is no longer healthy
✅ The market has transitioned into distribution / Diamond mode
5️⃣ Why You Should Not Trade Inside a Diamond
If you see:
Fake BOS signals
Repeated QM failures
Sharp moves in both directions
Constant rotation between premium & discount
⛔️ This is a wait-only environment, not an execution zone.
6️⃣ When Does the Real Target Activate?
Diamond height ≈ 140 pips
🎯 This target becomes valid only after:
A clean structural breakout
A confirmed pullback
Not while price is still inside the pattern
good luck

Haftungsausschluss
Die Informationen und Veröffentlichungen sind nicht als Finanz-, Anlage-, Handels- oder andere Arten von Ratschlägen oder Empfehlungen gedacht, die von TradingView bereitgestellt oder gebilligt werden, und stellen diese nicht dar. Lesen Sie mehr in den Nutzungsbedingungen.
Haftungsausschluss
Die Informationen und Veröffentlichungen sind nicht als Finanz-, Anlage-, Handels- oder andere Arten von Ratschlägen oder Empfehlungen gedacht, die von TradingView bereitgestellt oder gebilligt werden, und stellen diese nicht dar. Lesen Sie mehr in den Nutzungsbedingungen.