

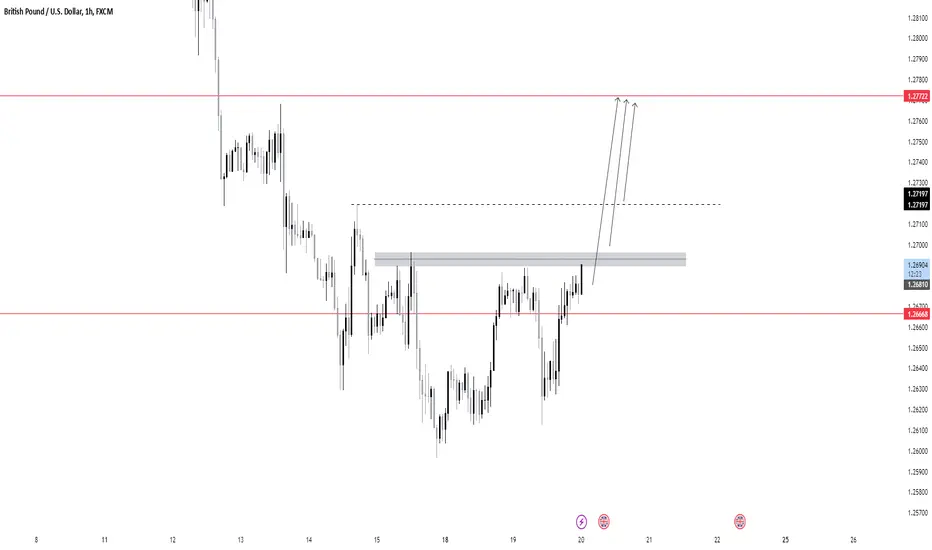
This chart displays the GBP/USD pair on the 1-hour timeframe currently leaning bullish, as the price has shown strength approaching the resistance.
The price is currently testing a key resistance zone around the 1.2689-1.2700 level, with potential bullish momentum indicated by the recent rally.
If the price breaks above the resistance zone and closes beyond 1.2700, it could indicate a continuation toward the next resistance level at 1.2777
The price is currently testing a key resistance zone around the 1.2689-1.2700 level, with potential bullish momentum indicated by the recent rally.
If the price breaks above the resistance zone and closes beyond 1.2700, it could indicate a continuation toward the next resistance level at 1.2777

iSmashProfit
Verbundene Veröffentlichungen
Haftungsausschluss
Die Informationen und Veröffentlichungen sind nicht als Finanz-, Anlage-, Handels- oder andere Arten von Ratschlägen oder Empfehlungen gedacht, die von TradingView bereitgestellt oder gebilligt werden, und stellen diese nicht dar. Lesen Sie mehr in den Nutzungsbedingungen.
iSmashProfit
Verbundene Veröffentlichungen
Haftungsausschluss
Die Informationen und Veröffentlichungen sind nicht als Finanz-, Anlage-, Handels- oder andere Arten von Ratschlägen oder Empfehlungen gedacht, die von TradingView bereitgestellt oder gebilligt werden, und stellen diese nicht dar. Lesen Sie mehr in den Nutzungsbedingungen.