
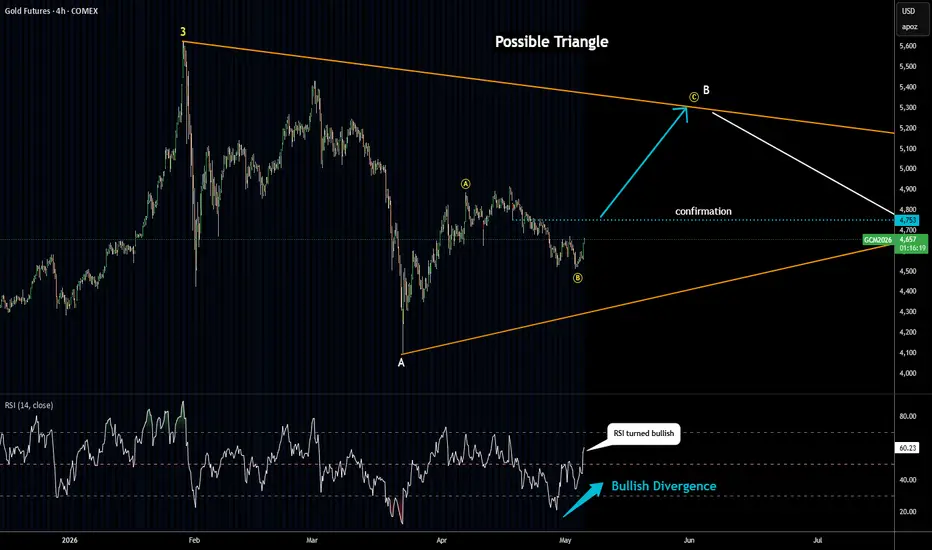
price moves along the established route as it sank
to preset Fibonacci retracement area
slashing half of previous growth in wave A of (B)
wave B of (B) looks completed, RSI shows Bullish Divergence and it already
crossed above the 50 "waterline", however it can dip one more time
confirmation for wave C of (B) is beyond $4,753 level where bottom
of wave 1 of B of (B) is located
target for wave C of (B) is at the top of possible triangle around $5,200-$5,300
where C = A of (B) and there is 76.4% Fibonacci retracement level

Verbundene Veröffentlichungen
Haftungsausschluss
Die Informationen und Veröffentlichungen sind nicht als Finanz-, Anlage-, Handels- oder andere Arten von Ratschlägen oder Empfehlungen gedacht, die von TradingView bereitgestellt oder gebilligt werden, und stellen diese nicht dar. Lesen Sie mehr in den Nutzungsbedingungen.