
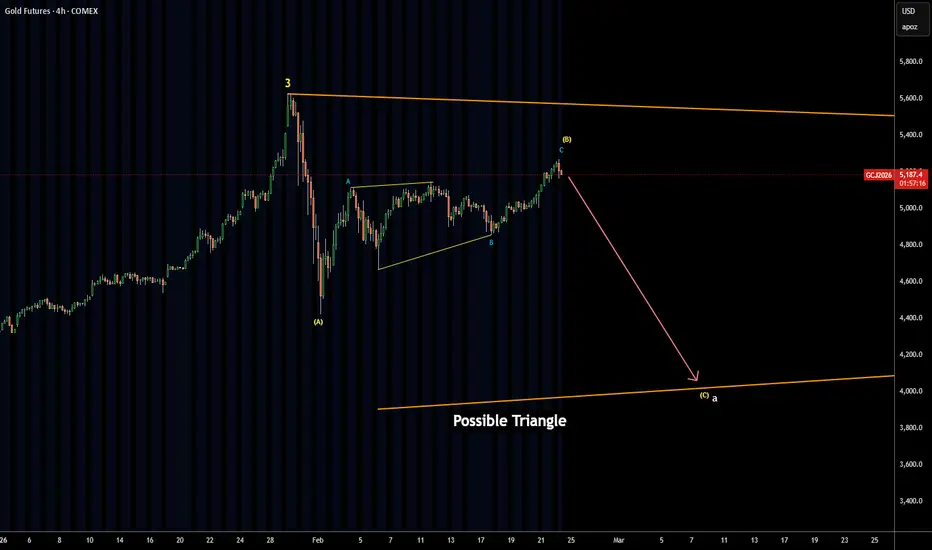
switched to 4-hour chart to show what's under the hood
of possible Triangle pattern
the first large wave A down (white) consists of three yellow waves ABC
yellow A was sharp and it's over
yellow B has three blue ABC subwaves
we got blue A and B definitely completed, wave C might be over
as it already surpassed the peak of blue A and is almost 61.8% of its size
next, yellow C is expected to follow to the downside
it might hit at least the bottom of wave A at $4,430 and dive
lower to $4,100
of possible Triangle pattern
the first large wave A down (white) consists of three yellow waves ABC
yellow A was sharp and it's over
yellow B has three blue ABC subwaves
we got blue A and B definitely completed, wave C might be over
as it already surpassed the peak of blue A and is almost 61.8% of its size
next, yellow C is expected to follow to the downside
it might hit at least the bottom of wave A at $4,430 and dive
lower to $4,100

Verbundene Veröffentlichungen
Haftungsausschluss
Die Informationen und Veröffentlichungen sind nicht als Finanz-, Anlage-, Handels- oder andere Arten von Ratschlägen oder Empfehlungen gedacht, die von TradingView bereitgestellt oder gebilligt werden, und stellen diese nicht dar. Lesen Sie mehr in den Nutzungsbedingungen.
Verbundene Veröffentlichungen
Haftungsausschluss
Die Informationen und Veröffentlichungen sind nicht als Finanz-, Anlage-, Handels- oder andere Arten von Ratschlägen oder Empfehlungen gedacht, die von TradingView bereitgestellt oder gebilligt werden, und stellen diese nicht dar. Lesen Sie mehr in den Nutzungsbedingungen.