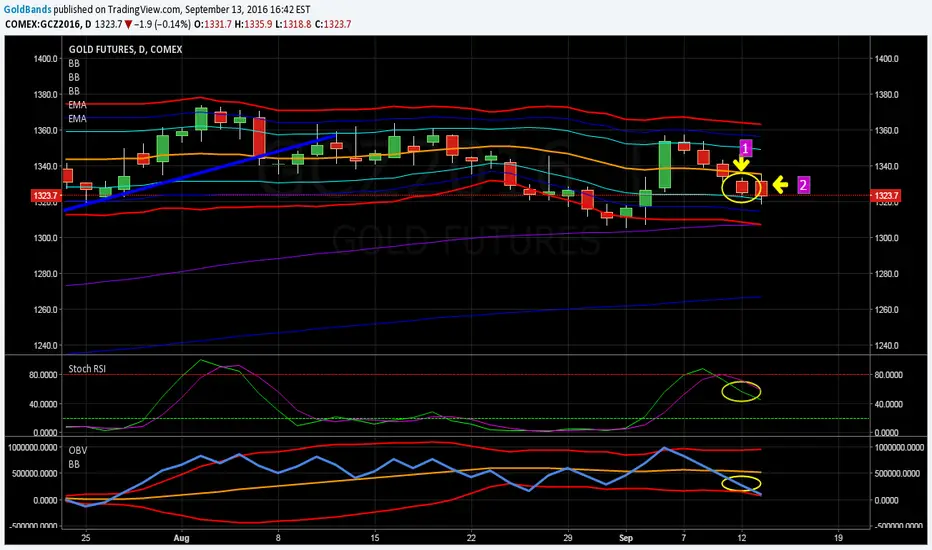
Yesterday, 9/12, saw continued downward movement in  Gold futures. While that was good for my short position (in at 1341.8), I was concerned because of the gap up at the close of day (#1). But here is why I stayed short and didn't close my position (reference the yellow circles on the Stoch RSI and OBV).
1. Stoch RSI is is an obvious downtrend.
2. OBV continued lower and was still above the lower Bollinger Band.
This confirmed that there is still downward movement in the current cycle. The combination of these 2 indicators kept me in the trade. I will be watching closely to see how the OBV reacts at the lower BB and see if we get more follow through to the downside.
Gold futures. While that was good for my short position (in at 1341.8), I was concerned because of the gap up at the close of day (#1). But here is why I stayed short and didn't close my position (reference the yellow circles on the Stoch RSI and OBV).1. Stoch RSI is is an obvious downtrend.
2. OBV continued lower and was still above the lower Bollinger Band.
This confirmed that there is still downward movement in the current cycle. The combination of these 2 indicators kept me in the trade. I will be watching closely to see how the OBV reacts at the lower BB and see if we get more follow through to the downside.
Trade ist aktiv
GOLD
Verbundene Veröffentlichungen
Haftungsausschluss
Die Informationen und Veröffentlichungen sind nicht als Finanz-, Anlage-, Handels- oder andere Arten von Ratschlägen oder Empfehlungen gedacht, die von TradingView bereitgestellt oder gebilligt werden, und stellen diese nicht dar. Lesen Sie mehr in den Nutzungsbedingungen.
Verbundene Veröffentlichungen
Haftungsausschluss
Die Informationen und Veröffentlichungen sind nicht als Finanz-, Anlage-, Handels- oder andere Arten von Ratschlägen oder Empfehlungen gedacht, die von TradingView bereitgestellt oder gebilligt werden, und stellen diese nicht dar. Lesen Sie mehr in den Nutzungsbedingungen.