
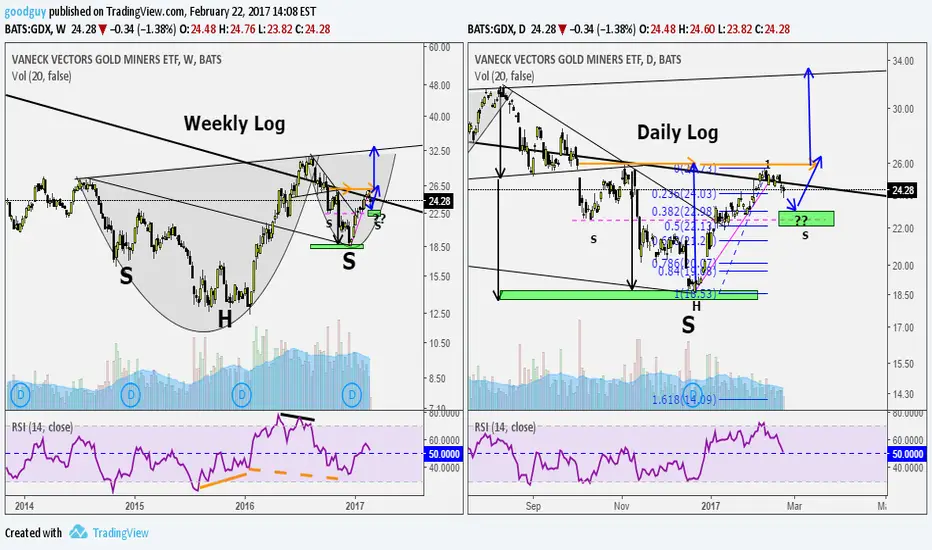
As the us dollar has been correcting up the gold miners has begun correcting down. I'm trying to get a handle on the bigger picture. On the weekly log chart it looks to me like a cup and handle or inverse H&S with the right side higher than the left which I believe is bullish. And to me it looks the handle of the cup is now forming possibly as smaller inverse H&S (see daily chart).
IF so the near term target may be at the .362-.5 correction level similar to the left shoulder marked "s". The horizontal lines the the top are for time equality which often occurs with H&S formation.
Hope this is helpful. Other ideas always glad to see.
IF so the near term target may be at the .362-.5 correction level similar to the left shoulder marked "s". The horizontal lines the the top are for time equality which often occurs with H&S formation.
Hope this is helpful. Other ideas always glad to see.
Anmerkung
Obviously correction deeper than I expected, now down about to .62 level. Needs to begin going up hear for formation to hold.seekingalpha.com/article/4052615-big-gold-miners-sector-trouble

Haftungsausschluss
Die Informationen und Veröffentlichungen sind nicht als Finanz-, Anlage-, Handels- oder andere Arten von Ratschlägen oder Empfehlungen gedacht, die von TradingView bereitgestellt oder gebilligt werden, und stellen diese nicht dar. Lesen Sie mehr in den Nutzungsbedingungen.
Haftungsausschluss
Die Informationen und Veröffentlichungen sind nicht als Finanz-, Anlage-, Handels- oder andere Arten von Ratschlägen oder Empfehlungen gedacht, die von TradingView bereitgestellt oder gebilligt werden, und stellen diese nicht dar. Lesen Sie mehr in den Nutzungsbedingungen.