
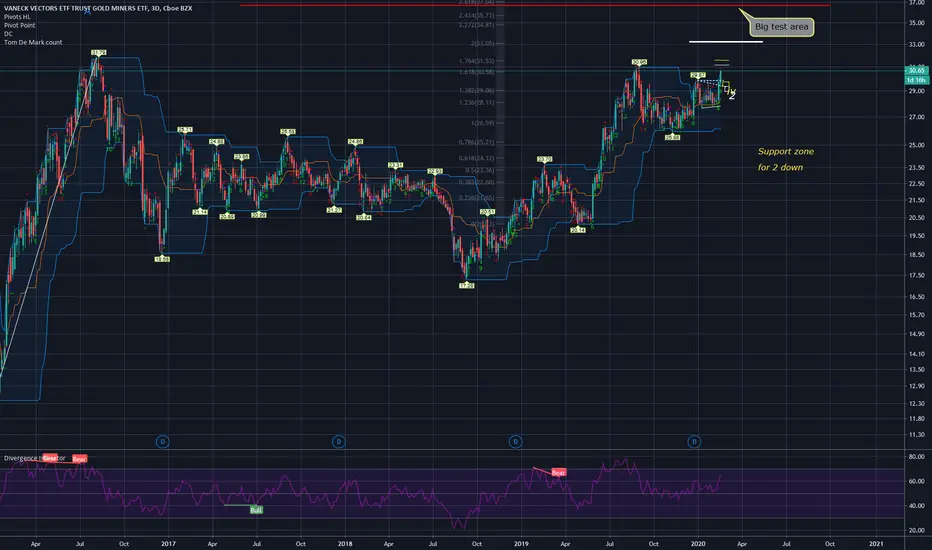
GDX 3 day chart 2/23/20
GDX is nearing a resistance zone. If GDX stops around 32 - 33 area and pulls back to the support zone then I will likely view GDX has a bull market to look forward to for a long term but if GDX extends to the red line around mid 36 area, then pulls back hard, I would view it bearish for GDX. Until now, it's been a fairly easy ride but it's time to buckle up.

GDX is nearing a resistance zone. If GDX stops around 32 - 33 area and pulls back to the support zone then I will likely view GDX has a bull market to look forward to for a long term but if GDX extends to the red line around mid 36 area, then pulls back hard, I would view it bearish for GDX. Until now, it's been a fairly easy ride but it's time to buckle up.
Anmerkung
2/27/20Pretty strong, nearly 12% pull back from the rejection of double top area.
Even when
 XAUUSD was trading positive, GDX was trading negative showing that many Miners were weak.
Path_1: Consolidate around here making a bull flag therefore creating Cup & Handle like pattern and go up. It will take some time.
Path_2: Consider a Diagonal count of 5 waves up completed. Now pull back to 24-25 area to build a base again.
Anmerkung
GDX 2 hour, 2/28/2020% down so far

Haftungsausschluss
Die Informationen und Veröffentlichungen sind nicht als Finanz-, Anlage-, Handels- oder andere Arten von Ratschlägen oder Empfehlungen gedacht, die von TradingView bereitgestellt oder gebilligt werden, und stellen diese nicht dar. Lesen Sie mehr in den Nutzungsbedingungen.
Haftungsausschluss
Die Informationen und Veröffentlichungen sind nicht als Finanz-, Anlage-, Handels- oder andere Arten von Ratschlägen oder Empfehlungen gedacht, die von TradingView bereitgestellt oder gebilligt werden, und stellen diese nicht dar. Lesen Sie mehr in den Nutzungsbedingungen.