
NSE:GLENMARK
Time Frame = Daily
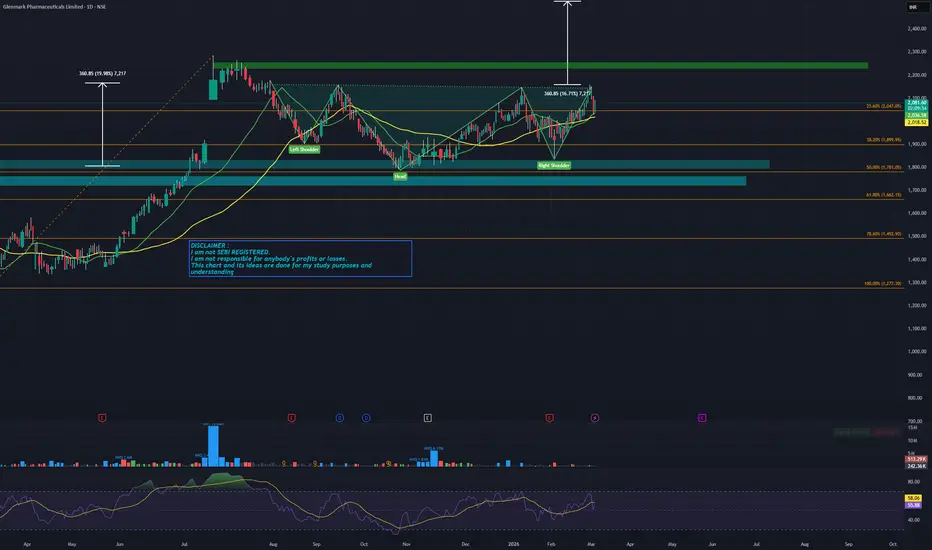
Pattern = Inverted Head & Shoulders
Understanding = Glenmark had a good run from 2023 till 2025. Then there was good profit booking till the major swing low of end feb 2025 till 1300 levels.. From there an upswing till 2284 was seen till July 2025.
After that it has dipped till a fibo level of 50% retracement but has also formed an inverted head and shoulders pattern, indicating a strong support zone of 1800-1950 levels..
Above 2160 we can see +2200 levels and then beyond that 2500 levels are possible.
DISCLAIMER :
I am not SEBI REGISTERED.
I am not responsible for anybody's profits or losses.
This chart and its ideas are done for my study purposes and understanding

Haftungsausschluss
Die Informationen und Veröffentlichungen sind nicht als Finanz-, Anlage-, Handels- oder andere Arten von Ratschlägen oder Empfehlungen gedacht, die von TradingView bereitgestellt oder gebilligt werden, und stellen diese nicht dar. Lesen Sie mehr in den Nutzungsbedingungen.
Haftungsausschluss
Die Informationen und Veröffentlichungen sind nicht als Finanz-, Anlage-, Handels- oder andere Arten von Ratschlägen oder Empfehlungen gedacht, die von TradingView bereitgestellt oder gebilligt werden, und stellen diese nicht dar. Lesen Sie mehr in den Nutzungsbedingungen.