
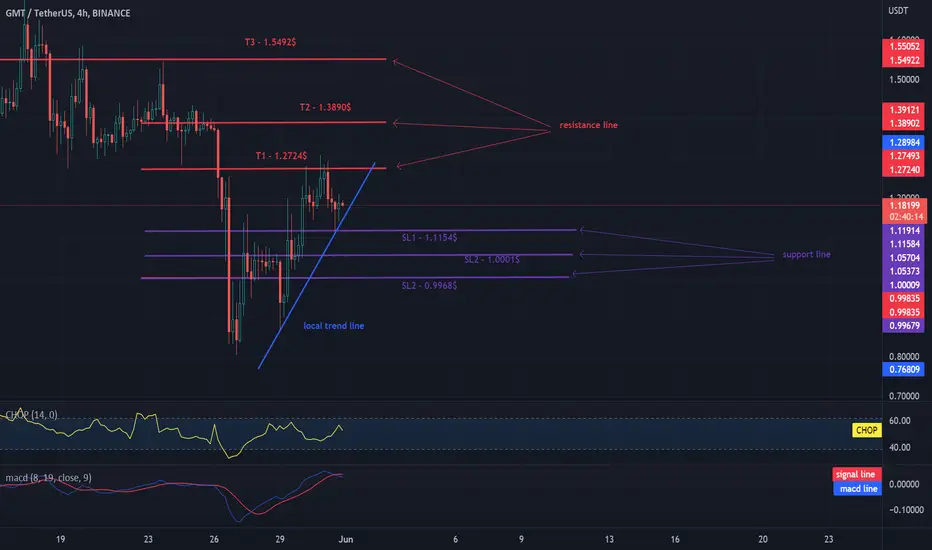
Hello everyone, let's take a look at the GMT to USDT chart over the 4 hour timeframe.
As you can see, the price is moving above the local trendline.
Let's start by identifying the stop loss we have in the near future:
SL1 - $ 1.1154
SL2 - $ 1,0001
SL2 - $ 0.9968
Now let's move on to the goals we may consider:
T1 - $ 1.2724
T2 - $ 1.3890
T3 - $ 1.5492
Looking at the CHOP indicator, we can see that in the 4H interval we have a lot of energy for the next move, while in the MACD indicator we see that the blue line crosses the red one from above, which could potentially lead to a further decline in the price.
Be careful and use stoploss in the short-term game.
As you can see, the price is moving above the local trendline.
Let's start by identifying the stop loss we have in the near future:
SL1 - $ 1.1154
SL2 - $ 1,0001
SL2 - $ 0.9968
Now let's move on to the goals we may consider:
T1 - $ 1.2724
T2 - $ 1.3890
T3 - $ 1.5492
Looking at the CHOP indicator, we can see that in the 4H interval we have a lot of energy for the next move, while in the MACD indicator we see that the blue line crosses the red one from above, which could potentially lead to a further decline in the price.
Be careful and use stoploss in the short-term game.

Haftungsausschluss
Die Informationen und Veröffentlichungen sind nicht als Finanz-, Anlage-, Handels- oder andere Arten von Ratschlägen oder Empfehlungen gedacht, die von TradingView bereitgestellt oder gebilligt werden, und stellen diese nicht dar. Lesen Sie mehr in den Nutzungsbedingungen.
Haftungsausschluss
Die Informationen und Veröffentlichungen sind nicht als Finanz-, Anlage-, Handels- oder andere Arten von Ratschlägen oder Empfehlungen gedacht, die von TradingView bereitgestellt oder gebilligt werden, und stellen diese nicht dar. Lesen Sie mehr in den Nutzungsbedingungen.