
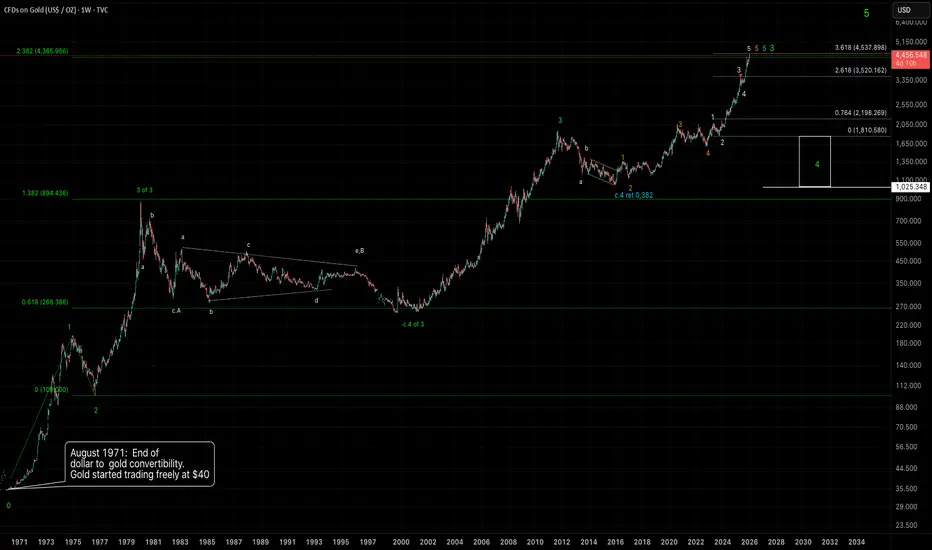
Gold started trading freely at 40 dollars in august 1971. This is a textbook elliottwave structure. Now gold has hit 2,382 extension where there is a nice confluence with the internal structure. This is the region where wave 3 ends. I expect a longterm downside wave 4 to the region marked by the rectangle. This region is 0,236 - 0,382 retracement measured between wave 2 and wave 3.

Haftungsausschluss
Die Informationen und Veröffentlichungen sind nicht als Finanz-, Anlage-, Handels- oder andere Arten von Ratschlägen oder Empfehlungen gedacht, die von TradingView bereitgestellt oder gebilligt werden, und stellen diese nicht dar. Lesen Sie mehr in den Nutzungsbedingungen.
Haftungsausschluss
Die Informationen und Veröffentlichungen sind nicht als Finanz-, Anlage-, Handels- oder andere Arten von Ratschlägen oder Empfehlungen gedacht, die von TradingView bereitgestellt oder gebilligt werden, und stellen diese nicht dar. Lesen Sie mehr in den Nutzungsbedingungen.