
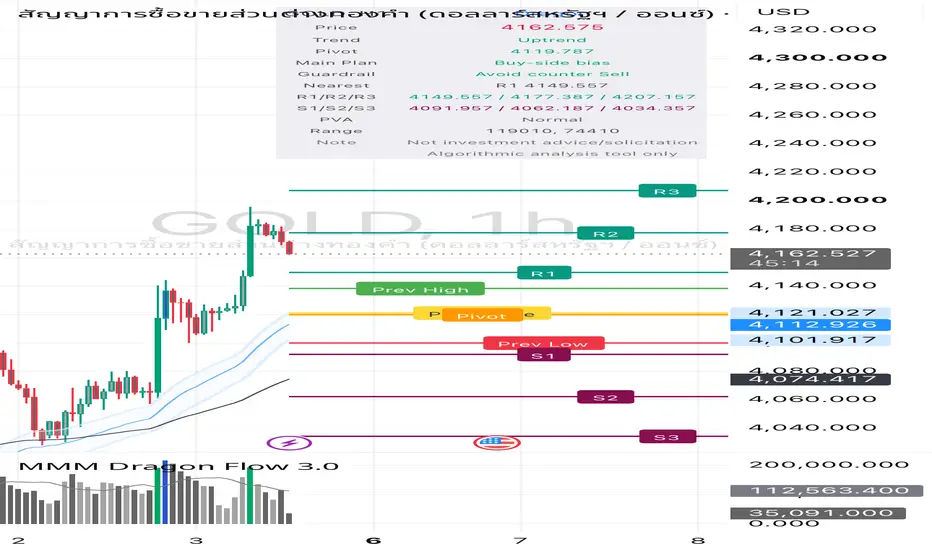
GOLD / XAUUSD CFD 1H Technical Outlook
Date: Friday, July 3, 2026
Instrument: GOLD / XAUUSD CFD
Timeframe: 1H
Current Price Area: 4,167.110
Market Condition: Uptrend / Buy-Side Bias
Gold is currently trading around the 4,167.110 area on the 1H timeframe after a strong bullish continuation move. Price has already broken above R1 at 4,149.557 and is now trading between R1 and R2, which shows that buyers remain in control of the short-term structure.
The broader intraday condition is still bullish. Price is holding well above the Pivot Point at 4,119.787, while the trading tool continues to classify the market as an Uptrend with a Buy-side bias. From a CFD trader’s perspective, this means the dominant flow still favors the upside, but new entries must be managed carefully because price is now approaching the next resistance level at R2: 4,177.387.
This is not an ideal area to chase late long positions without confirmation. The cleaner setups would be either a confirmed breakout above R2 or a controlled pullback toward R1 / Pivot where buyers can defend structure.
Key Levels
Resistance Levels:
- R1: 4,149.557
- R2: 4,177.387
- R3: 4,207.157
Pivot Point:
- Pivot: 4,119.787
Support Levels:
- S1: 4,091.957
- S2: 4,062.187
- S3: 4,034.357
Trading Tool Perspective
The trading assistant tool currently shows:
- Trend: Uptrend
- Main Plan: Buy-side bias
- Guardrail: Avoid counter Sell
- Nearest Key Level: R2 at 4,177.387
- PVA Status: Normal
This confirms that the current market structure remains bullish. The tool is also warning against counter-trend selling, which means short positions should be avoided unless price clearly breaks back below the bullish structure.
A sustained break and hold above 4,177.387 would support further bullish continuation toward R3 at 4,207.157. If momentum expands with stronger candle structure and rising volume, buyers may continue to control the session.
On the downside, R1 at 4,149.557 becomes the first important support after the breakout. If price pulls back and holds above R1, the bullish structure remains healthy. However, if price loses R1 and starts moving back toward the Pivot Point at 4,119.787, short-term momentum may weaken.
The cleaner tactical scenarios are:
1. Bullish continuation scenario:
Price breaks and holds above R2 at 4,177.387, confirming continuation toward R3 at 4,207.157.
2. Pullback-buy scenario:
Price pulls back toward R1 at 4,149.557, holds above it, and forms a bullish rejection structure.
3. Bullish failure scenario:
Price loses R1 and rotates back toward the pivot at 4,119.787, reducing the strength of the current buy-side bias.
For now, GOLD remains in an uptrend structure with buy-side control. The preferred approach is to avoid counter-trend selling and wait for either a confirmed breakout above R2 or a controlled pullback into support.
Risk Warning
This analysis is for educational purposes only and does not constitute financial advice, investment advice, or a trading signal. Trading Gold CFDs, forex, futures, commodities, and leveraged products involves substantial risk and may not be suitable for all traders. Leverage can amplify both profits and losses. Always define your risk before entering a position, use proper position sizing, and trade only according to your own strategy, capital size, and risk tolerance.
Date: Friday, July 3, 2026
Instrument: GOLD / XAUUSD CFD
Timeframe: 1H
Current Price Area: 4,167.110
Market Condition: Uptrend / Buy-Side Bias
Gold is currently trading around the 4,167.110 area on the 1H timeframe after a strong bullish continuation move. Price has already broken above R1 at 4,149.557 and is now trading between R1 and R2, which shows that buyers remain in control of the short-term structure.
The broader intraday condition is still bullish. Price is holding well above the Pivot Point at 4,119.787, while the trading tool continues to classify the market as an Uptrend with a Buy-side bias. From a CFD trader’s perspective, this means the dominant flow still favors the upside, but new entries must be managed carefully because price is now approaching the next resistance level at R2: 4,177.387.
This is not an ideal area to chase late long positions without confirmation. The cleaner setups would be either a confirmed breakout above R2 or a controlled pullback toward R1 / Pivot where buyers can defend structure.
Key Levels
Resistance Levels:
- R1: 4,149.557
- R2: 4,177.387
- R3: 4,207.157
Pivot Point:
- Pivot: 4,119.787
Support Levels:
- S1: 4,091.957
- S2: 4,062.187
- S3: 4,034.357
Trading Tool Perspective
The trading assistant tool currently shows:
- Trend: Uptrend
- Main Plan: Buy-side bias
- Guardrail: Avoid counter Sell
- Nearest Key Level: R2 at 4,177.387
- PVA Status: Normal
This confirms that the current market structure remains bullish. The tool is also warning against counter-trend selling, which means short positions should be avoided unless price clearly breaks back below the bullish structure.
A sustained break and hold above 4,177.387 would support further bullish continuation toward R3 at 4,207.157. If momentum expands with stronger candle structure and rising volume, buyers may continue to control the session.
On the downside, R1 at 4,149.557 becomes the first important support after the breakout. If price pulls back and holds above R1, the bullish structure remains healthy. However, if price loses R1 and starts moving back toward the Pivot Point at 4,119.787, short-term momentum may weaken.
The cleaner tactical scenarios are:
1. Bullish continuation scenario:
Price breaks and holds above R2 at 4,177.387, confirming continuation toward R3 at 4,207.157.
2. Pullback-buy scenario:
Price pulls back toward R1 at 4,149.557, holds above it, and forms a bullish rejection structure.
3. Bullish failure scenario:
Price loses R1 and rotates back toward the pivot at 4,119.787, reducing the strength of the current buy-side bias.
For now, GOLD remains in an uptrend structure with buy-side control. The preferred approach is to avoid counter-trend selling and wait for either a confirmed breakout above R2 or a controlled pullback into support.
Risk Warning
This analysis is for educational purposes only and does not constitute financial advice, investment advice, or a trading signal. Trading Gold CFDs, forex, futures, commodities, and leveraged products involves substantial risk and may not be suitable for all traders. Leverage can amplify both profits and losses. Always define your risk before entering a position, use proper position sizing, and trade only according to your own strategy, capital size, and risk tolerance.

Haftungsausschluss
Die Informationen und Veröffentlichungen sind nicht als Finanz-, Anlage-, Handels- oder andere Arten von Ratschlägen oder Empfehlungen gedacht, die von TradingView bereitgestellt oder gebilligt werden, und stellen diese nicht dar. Lesen Sie mehr in den Nutzungsbedingungen.
Haftungsausschluss
Die Informationen und Veröffentlichungen sind nicht als Finanz-, Anlage-, Handels- oder andere Arten von Ratschlägen oder Empfehlungen gedacht, die von TradingView bereitgestellt oder gebilligt werden, und stellen diese nicht dar. Lesen Sie mehr in den Nutzungsbedingungen.