
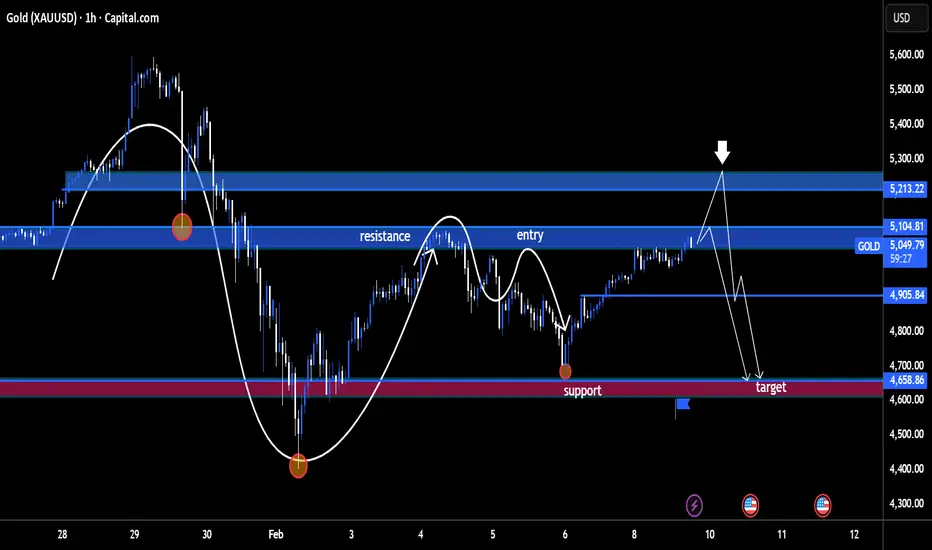
Market Structure
Overall structure is bearish-to-range after a strong selloff.
Price made a rounded bottom from the Feb lows, then transitioned into a corrective rally.
The rally is retracing into a prior supply / resistance zone, not breaking structure yet.
Key Zones
Major Resistance / Supply: ~5,100 – 5,213
Marked clearly on your chart.
Previous breakdown zone → now acting as resistance.
Minor Resistance (Entry Zone): ~5,050 – 5,105
Price is currently reacting here.
Prior support turned resistance (classic S/R flip).
Support: ~4,650 – 4,700
Strong demand zone.
Previous reaction + liquidity pool.
Intermediate Support: ~4,905
Likely first pause or bounce area if rejection starts.
Price Action Story
The white path shows a corrective ABC-style move into resistance.
Momentum on the way up is weaker compared to the selloff (bearish sign).
No clean bullish break-and-hold above the resistance zone yet.
This favors a rejection rather than continuation.
Trade Idea (As Illustrated)
Bias: Short
Entry: Into 5,050 – 5,100 resistance
Invalidation: Clean 1H close and acceptance above ~5,213
Targets:
~4,905 (partial / scale-out)
~4,650 (main target / demand zone)
What Would Flip This Bullish?
Strong impulsive break above 5,213
Followed by a successful retest and hold
Until then → rallies are suspect.
Summary
This is a sell-the-rally setup into a well-defined resistance zone, aiming for a move back into demand. The chart is structured, levels are respected, and the risk is clearly defined — exactly how you want it.
Trade ist aktiv

Haftungsausschluss
Die Informationen und Veröffentlichungen sind nicht als Finanz-, Anlage-, Handels- oder andere Arten von Ratschlägen oder Empfehlungen gedacht, die von TradingView bereitgestellt oder gebilligt werden, und stellen diese nicht dar. Lesen Sie mehr in den Nutzungsbedingungen.
Haftungsausschluss
Die Informationen und Veröffentlichungen sind nicht als Finanz-, Anlage-, Handels- oder andere Arten von Ratschlägen oder Empfehlungen gedacht, die von TradingView bereitgestellt oder gebilligt werden, und stellen diese nicht dar. Lesen Sie mehr in den Nutzungsbedingungen.