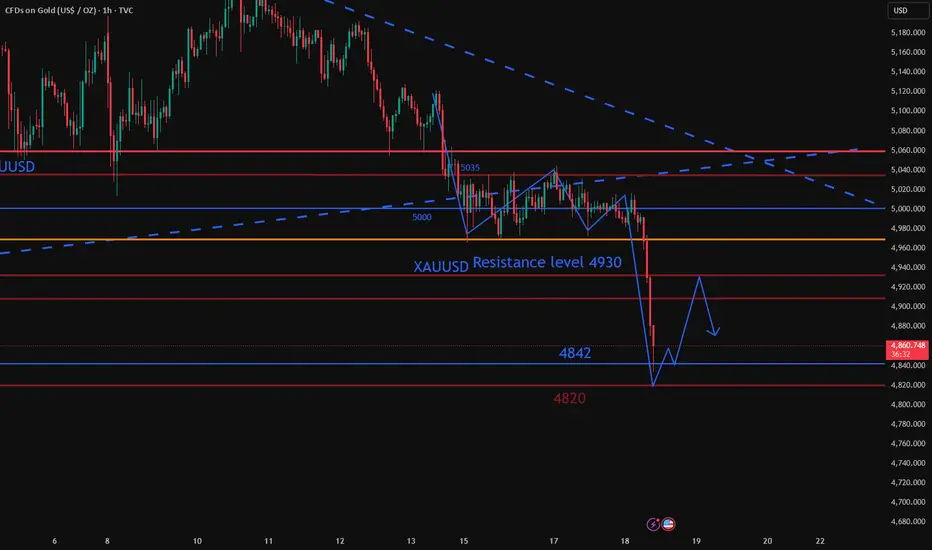
Price movements during Asian and European trading sessions: Spot gold/dollar experienced a sharp sell-off during the European trading session, with prices plummeting and breaking through key psychological levels of $5,000/oz and $4,900/oz, reaching an intraday low of $4,843/oz. Precious metal prices fell by more than 100 basis points during the session, marking a complete collapse of bearish sentiment as the market briefly consolidated near lows ahead of the Fed's key policy decision.
Key bearish catalyst
The root cause of this plunge lies in the market's repricing of expectations for a hawkish stance from the Federal Reserve's monetary policy. The market consensus is that the Federal Reserve will keep the benchmark interest rate unchanged at the March FOMC meeting, while the surge in oil prices has once again raised inflation risks and prolonged the period of high interest rates.
At the same time, the US dollar index (DXY) and the yield on long-term US Treasury bonds rose in tandem, diminishing the relative attractiveness of non-yielding gold. Risk aversion ahead of the Federal Reserve meeting prompted institutional investors to actively close positions and implement algorithmic stop-loss orders, exacerbating short-term selling pressure. Despite ongoing geopolitical tensions in the Middle East, safe-haven flows have completely disappeared due to the adverse effects of a stronger dollar and hawkish policy leanings, resulting in a one-sidedly bearish macroeconomic environment.
Technical Analysis
Daily Chart: XAU broke below the key moving average and the Bollinger Band middle line, confirming a bearish structural shift. The MACD indicator has crossed below the death cross, and the KDJ oscillator has also fallen sharply into the oversold zone, consolidating the deep downtrend. The previous strong support level has now turned into a strong resistance level, limiting the potential for a price rebound.
4-hour chart: After the sell-off during the European trading session, prices have entered a period of consolidation at low levels, with the Bollinger Bands sloping downwards. A narrow resistance zone has formed between $4,930 and $4,950 per ounce, with short-term tactical support at $4,835 to $4,800 per ounce. Although oversold indicators show a slight tendency toward technical mean reversion, the rebound may be small given the overall weak market structure.
Trading Preference During US Session
During the US trading session, the market sentiment remains bearish, facing downward pressure within a range. The core strategy is to sell short on rallies; avoid aggressive bottom-fishing and only engage in short-term trading during rebounds. Consider shorting with a small position in the $4920-$4930/oz range, and only consider tactical short-term long positions when the price stabilizes at $4830-$4835/oz.
We welcome all traders to share their opinions, and let's move forward together in this market.
 XAUUSD GOLD XAUUSD GOLD1! XAUUSD
Key bearish catalyst
The root cause of this plunge lies in the market's repricing of expectations for a hawkish stance from the Federal Reserve's monetary policy. The market consensus is that the Federal Reserve will keep the benchmark interest rate unchanged at the March FOMC meeting, while the surge in oil prices has once again raised inflation risks and prolonged the period of high interest rates.
At the same time, the US dollar index (DXY) and the yield on long-term US Treasury bonds rose in tandem, diminishing the relative attractiveness of non-yielding gold. Risk aversion ahead of the Federal Reserve meeting prompted institutional investors to actively close positions and implement algorithmic stop-loss orders, exacerbating short-term selling pressure. Despite ongoing geopolitical tensions in the Middle East, safe-haven flows have completely disappeared due to the adverse effects of a stronger dollar and hawkish policy leanings, resulting in a one-sidedly bearish macroeconomic environment.
Technical Analysis
Daily Chart: XAU broke below the key moving average and the Bollinger Band middle line, confirming a bearish structural shift. The MACD indicator has crossed below the death cross, and the KDJ oscillator has also fallen sharply into the oversold zone, consolidating the deep downtrend. The previous strong support level has now turned into a strong resistance level, limiting the potential for a price rebound.
4-hour chart: After the sell-off during the European trading session, prices have entered a period of consolidation at low levels, with the Bollinger Bands sloping downwards. A narrow resistance zone has formed between $4,930 and $4,950 per ounce, with short-term tactical support at $4,835 to $4,800 per ounce. Although oversold indicators show a slight tendency toward technical mean reversion, the rebound may be small given the overall weak market structure.
Trading Preference During US Session
During the US trading session, the market sentiment remains bearish, facing downward pressure within a range. The core strategy is to sell short on rallies; avoid aggressive bottom-fishing and only engage in short-term trading during rebounds. Consider shorting with a small position in the $4920-$4930/oz range, and only consider tactical short-term long positions when the price stabilizes at $4830-$4835/oz.
We welcome all traders to share their opinions, and let's move forward together in this market.
XAUUSD GOLD XAUUSD GOLD1! XAUUSD Trade ist aktiv
Since the market opened this Monday, my analyses have generally aligned with market trends. I believe traders who followed my analyses have been able to attest to this. Overall, however, I am not entirely satisfied because they have not met my overall expectations. Therefore, I will continue to work hard to conquer this market.
Haftungsausschluss
Die Informationen und Veröffentlichungen sind nicht als Finanz-, Anlage-, Handels- oder andere Arten von Ratschlägen oder Empfehlungen gedacht, die von TradingView bereitgestellt oder gebilligt werden, und stellen diese nicht dar. Lesen Sie mehr in den Nutzungsbedingungen.
Haftungsausschluss
Die Informationen und Veröffentlichungen sind nicht als Finanz-, Anlage-, Handels- oder andere Arten von Ratschlägen oder Empfehlungen gedacht, die von TradingView bereitgestellt oder gebilligt werden, und stellen diese nicht dar. Lesen Sie mehr in den Nutzungsbedingungen.