
Hello Traders,
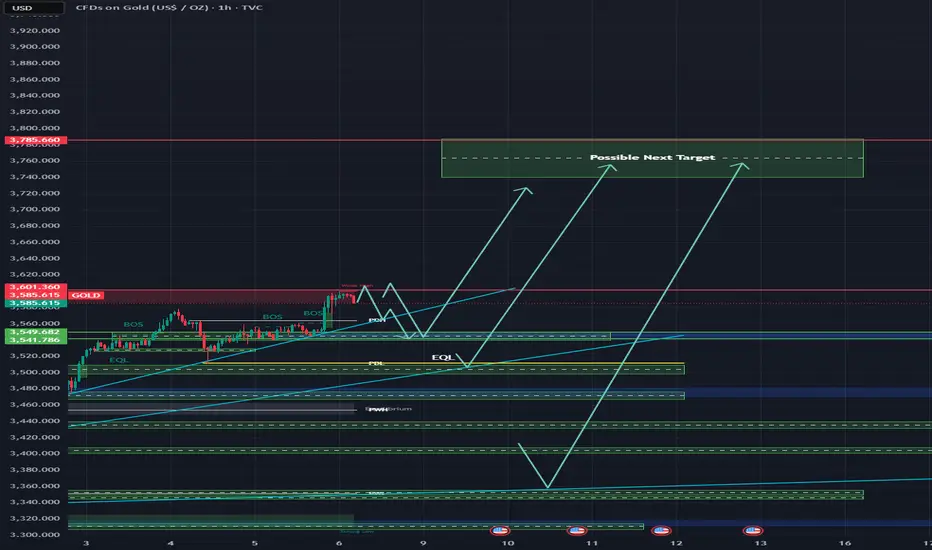
🔥 Gold has powered into $3600 — right on track with our plan. If you didn’t ride the full wave, no worries — price action always gifts new entries and exits.
Now comes the big question: Do we run straight to $3700, or pull back toward $3550 first?
This week’s spotlight: Inflation data (PPI & CPI).
Hot prints → stronger USD → possible gold correction
Soft prints → weaker USD → fuel for further upside
Technical : Weekly RSI >70 → momentum is strong, but conditions are stretched, making retracements possible.
Macro: Geopolitical tensions + safe-haven demand keep the bigger bullish picture intact.
👉 Our stance: Still bullish, with targets now extended to $3745. Here is the breakdown :
Weekly Price Map & Scenarios
Bullish Scenario
Base Case: Gold consolidates around $3,600, building on the breakout.
Upside Target: Move toward $3,689–3,700 by week’s end, aligned with algorithmic and institutional forecasts.
Extended Target: If momentum accelerates, institutional optics suggest extension toward $4,000+.
Sideways / Neutral
Expect range-bound trading between $3,600–3,650 early in the week. This gives way to breakout moves in response to macro cues (employment data, Fed tone).
Bearish Risk
Though unlikely given current momentum, a hawkish Fed or strong U.S. data could stall the trend. In that scenario, look for pullback levels near $3,550–3,570 as support.
🔑 Key Levels
Support (demand zones):
3550–3530 → Bulls’ lifeline (EMA support).
3525–3480 → Strong base if deeper retrace.
3375–3325 → Mid-range defence, breakout base.
Resistance (supply zones):
3620–3640 → First ceiling.
3665–3700 → Major supply cluster.
3810–3860 → Extended bullish target if CPI comes soft.
📌 Scenarios
🟢 Bullish Path
Hold above 3550 → push toward 3620–3665.
Break & hold above 3700 → unlocks 3810–3860.
🔴 Bearish Path
Rejection at 3620/3665 → correction into 3550–3520.
Hot CPI/PPI → break below 3525 → opens 3375–3325.
✅ Action Plan
Above 3550 = bullish continuation bias.
Below 3525 = correction bias.
🔥 Gold has powered into $3600 — right on track with our plan. If you didn’t ride the full wave, no worries — price action always gifts new entries and exits.
Now comes the big question: Do we run straight to $3700, or pull back toward $3550 first?
This week’s spotlight: Inflation data (PPI & CPI).
Hot prints → stronger USD → possible gold correction
Soft prints → weaker USD → fuel for further upside
Technical : Weekly RSI >70 → momentum is strong, but conditions are stretched, making retracements possible.
Macro: Geopolitical tensions + safe-haven demand keep the bigger bullish picture intact.
👉 Our stance: Still bullish, with targets now extended to $3745. Here is the breakdown :
Weekly Price Map & Scenarios
Bullish Scenario
Base Case: Gold consolidates around $3,600, building on the breakout.
Upside Target: Move toward $3,689–3,700 by week’s end, aligned with algorithmic and institutional forecasts.
Extended Target: If momentum accelerates, institutional optics suggest extension toward $4,000+.
Sideways / Neutral
Expect range-bound trading between $3,600–3,650 early in the week. This gives way to breakout moves in response to macro cues (employment data, Fed tone).
Bearish Risk
Though unlikely given current momentum, a hawkish Fed or strong U.S. data could stall the trend. In that scenario, look for pullback levels near $3,550–3,570 as support.
🔑 Key Levels
Support (demand zones):
3550–3530 → Bulls’ lifeline (EMA support).
3525–3480 → Strong base if deeper retrace.
3375–3325 → Mid-range defence, breakout base.
Resistance (supply zones):
3620–3640 → First ceiling.
3665–3700 → Major supply cluster.
3810–3860 → Extended bullish target if CPI comes soft.
📌 Scenarios
🟢 Bullish Path
Hold above 3550 → push toward 3620–3665.
Break & hold above 3700 → unlocks 3810–3860.
🔴 Bearish Path
Rejection at 3620/3665 → correction into 3550–3520.
Hot CPI/PPI → break below 3525 → opens 3375–3325.
✅ Action Plan
Above 3550 = bullish continuation bias.
Below 3525 = correction bias.

Haftungsausschluss
Die Informationen und Veröffentlichungen sind nicht als Finanz-, Anlage-, Handels- oder andere Arten von Ratschlägen oder Empfehlungen gedacht, die von TradingView bereitgestellt oder gebilligt werden, und stellen diese nicht dar. Lesen Sie mehr in den Nutzungsbedingungen.
Haftungsausschluss
Die Informationen und Veröffentlichungen sind nicht als Finanz-, Anlage-, Handels- oder andere Arten von Ratschlägen oder Empfehlungen gedacht, die von TradingView bereitgestellt oder gebilligt werden, und stellen diese nicht dar. Lesen Sie mehr in den Nutzungsbedingungen.