
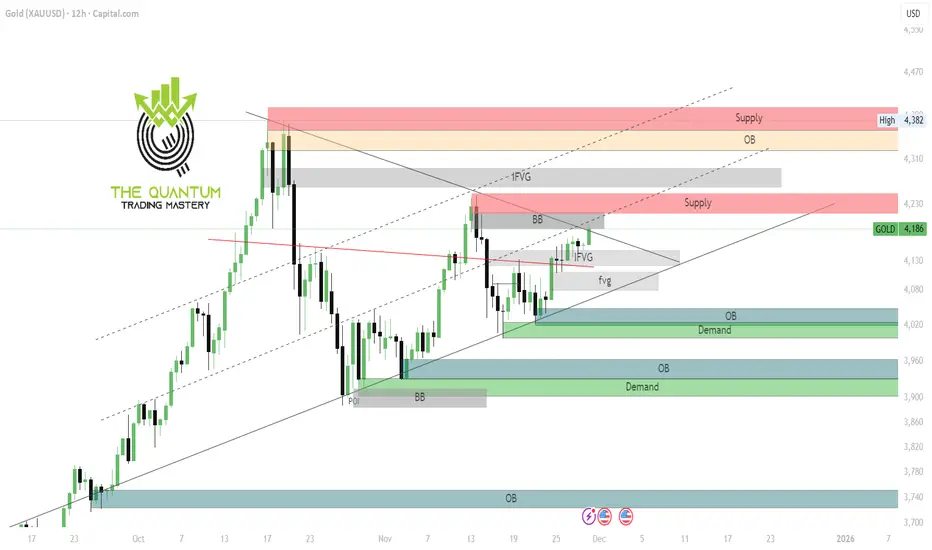
Please review our updated 12H chart route map with the latest levels.
The 1H and 4H timeframes I shared earlier played out exactly as expected. Now, I’m sharing the 12H GOLD chart to give you a clearer, bigger-picture outlook. Please read the caption carefully.
Price is currently trading within the broader on 12H Chart between 4000 - 4230 range. The channel half-line and symmetrical top line continue to act as major resistance, with the BB (Breaker Block) adding further resistance just below the supply area.
If the current support holds and price rejects from the BB Or the supply zone, or below the half-line, we can expect a move toward the 4130 target and this could open the swing range for a deeper test before a potential bounce. A clean break above 4230 would confirm bullish continuation to the upside.
We will factor all of this into our buy setups from dip levels. Our updated levels and weighted zones will help us monitor downside movement and capitalize on bounces through smaller-timeframe strategies.
Our long-term bias remains bullish, so we welcome corrective pullbacks. These dips provide safer opportunities to buy from strong levels rather than chasing the bullish move at the top.
Thank you all for your likes, comments, and follows — we truly appreciate your support!
The Quantum Trading Mastery
The 1H and 4H timeframes I shared earlier played out exactly as expected. Now, I’m sharing the 12H GOLD chart to give you a clearer, bigger-picture outlook. Please read the caption carefully.
Price is currently trading within the broader on 12H Chart between 4000 - 4230 range. The channel half-line and symmetrical top line continue to act as major resistance, with the BB (Breaker Block) adding further resistance just below the supply area.
If the current support holds and price rejects from the BB Or the supply zone, or below the half-line, we can expect a move toward the 4130 target and this could open the swing range for a deeper test before a potential bounce. A clean break above 4230 would confirm bullish continuation to the upside.
We will factor all of this into our buy setups from dip levels. Our updated levels and weighted zones will help us monitor downside movement and capitalize on bounces through smaller-timeframe strategies.
Our long-term bias remains bullish, so we welcome corrective pullbacks. These dips provide safer opportunities to buy from strong levels rather than chasing the bullish move at the top.
Thank you all for your likes, comments, and follows — we truly appreciate your support!
The Quantum Trading Mastery
Trade ist aktiv
Trade geschlossen: Ziel wurde erreicht
Target Reached successfully
Verbundene Veröffentlichungen
Haftungsausschluss
Die Informationen und Veröffentlichungen sind nicht als Finanz-, Anlage-, Handels- oder andere Arten von Ratschlägen oder Empfehlungen gedacht, die von TradingView bereitgestellt oder gebilligt werden, und stellen diese nicht dar. Lesen Sie mehr in den Nutzungsbedingungen.
Verbundene Veröffentlichungen
Haftungsausschluss
Die Informationen und Veröffentlichungen sind nicht als Finanz-, Anlage-, Handels- oder andere Arten von Ratschlägen oder Empfehlungen gedacht, die von TradingView bereitgestellt oder gebilligt werden, und stellen diese nicht dar. Lesen Sie mehr in den Nutzungsbedingungen.