
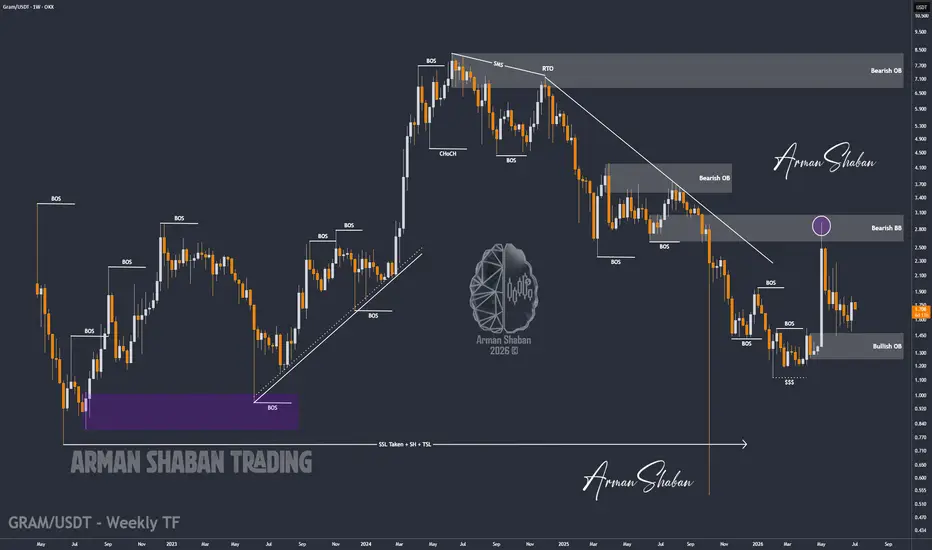
By analyzing the #GRAM chart on the weekly timeframe, we can see that after the previous analysis, price started to move higher and managed to rally more than 25%, reaching the $1.85 region. Currently, GRAM is trading around $1.72, and the key question now is whether buyers can regain momentum from this area and start the next bullish leg.
In my view, if bullish momentum returns, the next upside targets to monitor are $1.90, followed by $2.20, then $2.60, $2.90, and potentially $3.40 if the broader crypto market supports the move. Based on the current price around $1.72, the medium-term upside potential toward $2.60 – $2.90 would be around 50% to 70%. For the longer-term scenario, if GRAM manages to push toward $3.40 – $4.20, the potential upside could reach roughly 100% to 145%.
For now, GRAM has already reacted well from the previous demand area, and we need to see if buyers can turn this pullback into the next major bullish expansion.
Please support me with your likes and comments to motivate me to share more analysis with you and share your opinion about the possible trend of this chart with me !
Best Regards , Arman Shaban
In my view, if bullish momentum returns, the next upside targets to monitor are $1.90, followed by $2.20, then $2.60, $2.90, and potentially $3.40 if the broader crypto market supports the move. Based on the current price around $1.72, the medium-term upside potential toward $2.60 – $2.90 would be around 50% to 70%. For the longer-term scenario, if GRAM manages to push toward $3.40 – $4.20, the potential upside could reach roughly 100% to 145%.
For now, GRAM has already reacted well from the previous demand area, and we need to see if buyers can turn this pullback into the next major bullish expansion.
Please support me with your likes and comments to motivate me to share more analysis with you and share your opinion about the possible trend of this chart with me !
Best Regards , Arman Shaban
Trade ist aktiv
By analyzing the #GRAM chart on the weekly timeframe, we can see that the previous analysis is still valid and the chart is actually becoming more interesting. Currently, GRAM is trading around the $1.66 region and buyers are still trying to defend the structure after the recent recovery. In my view, as long as price continues to hold above the previous demand area, the bullish scenario remains active.The next upside targets to monitor are $1.75, followed by $1.90, then $2.20, $2.60, $2.90, and potentially $3.40 if momentum continues to build.
Based on the current price around $1.66, a move toward $2.60 to $2.90 would mean roughly 55% to 75% potential upside. In the longer-term scenario, if GRAM manages to push toward $3.40 to $4.20, the potential upside could reach around 100% to 150%. For now, nothing major has changed. GRAM is still holding the structure, and in my view this chart is worth watching closely for the next bullish expansion.

📘 Wanna Learn ICT & SMC? Get the Full Book Here : bit.ly/ICT-BOOK
⚜️ Free Telegram Channel : telegram.me/PriceAction_ICT
⚜️ JOIN THE VIP 👉 t.me/ArmanShabanTrading
🚀 MondFX — our trusted Broker : bit.ly/MondFx
⚜️ Free Telegram Channel : telegram.me/PriceAction_ICT
⚜️ JOIN THE VIP 👉 t.me/ArmanShabanTrading
🚀 MondFX — our trusted Broker : bit.ly/MondFx
Verbundene Veröffentlichungen
Haftungsausschluss
Die Informationen und Veröffentlichungen sind nicht als Finanz-, Anlage-, Handels- oder andere Arten von Ratschlägen oder Empfehlungen gedacht, die von TradingView bereitgestellt oder gebilligt werden, und stellen diese nicht dar. Lesen Sie mehr in den Nutzungsbedingungen.
📘 Wanna Learn ICT & SMC? Get the Full Book Here : bit.ly/ICT-BOOK
⚜️ Free Telegram Channel : telegram.me/PriceAction_ICT
⚜️ JOIN THE VIP 👉 t.me/ArmanShabanTrading
🚀 MondFX — our trusted Broker : bit.ly/MondFx
⚜️ Free Telegram Channel : telegram.me/PriceAction_ICT
⚜️ JOIN THE VIP 👉 t.me/ArmanShabanTrading
🚀 MondFX — our trusted Broker : bit.ly/MondFx
Verbundene Veröffentlichungen
Haftungsausschluss
Die Informationen und Veröffentlichungen sind nicht als Finanz-, Anlage-, Handels- oder andere Arten von Ratschlägen oder Empfehlungen gedacht, die von TradingView bereitgestellt oder gebilligt werden, und stellen diese nicht dar. Lesen Sie mehr in den Nutzungsbedingungen.