The Graph: Updated
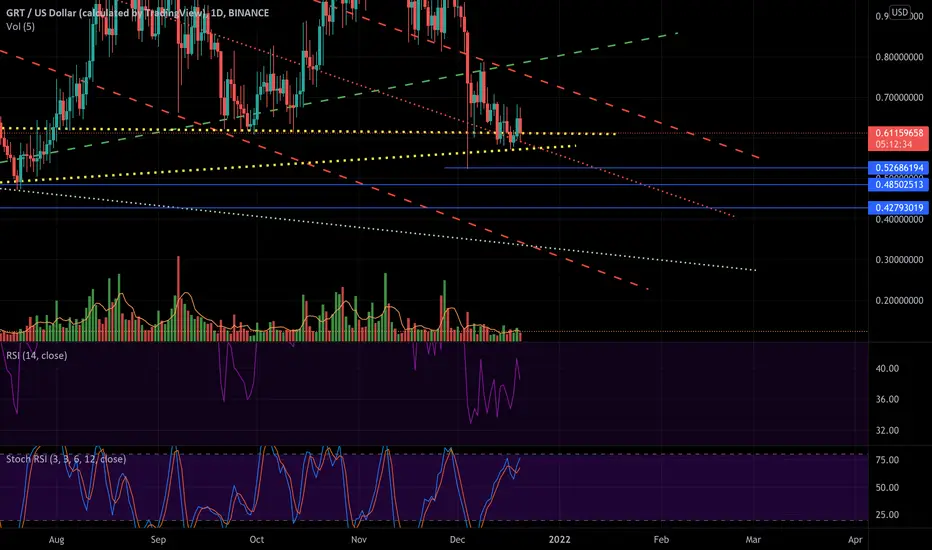
I should have included price levels from previous sell-offs earlier this year (horizontal Blue lines). Original post linked below.
It’s interesting to note that these Blue lines fro previous sell-off intersect our trend-channel early next year. We’ll see if they actually have a “tale” to tell (at the “tail” of the channel) or not (in which case, they’re just a bunch of lines).
It’s interesting to note that these Blue lines fro previous sell-off intersect our trend-channel early next year. We’ll see if they actually have a “tale” to tell (at the “tail” of the channel) or not (in which case, they’re just a bunch of lines).

Verbundene Veröffentlichungen
Haftungsausschluss
Die Informationen und Veröffentlichungen sind nicht als Finanz-, Anlage-, Handels- oder andere Arten von Ratschlägen oder Empfehlungen gedacht, die von TradingView bereitgestellt oder gebilligt werden, und stellen diese nicht dar. Lesen Sie mehr in den Nutzungsbedingungen.
Verbundene Veröffentlichungen
Haftungsausschluss
Die Informationen und Veröffentlichungen sind nicht als Finanz-, Anlage-, Handels- oder andere Arten von Ratschlägen oder Empfehlungen gedacht, die von TradingView bereitgestellt oder gebilligt werden, und stellen diese nicht dar. Lesen Sie mehr in den Nutzungsbedingungen.