GST stabilizes around $ 3
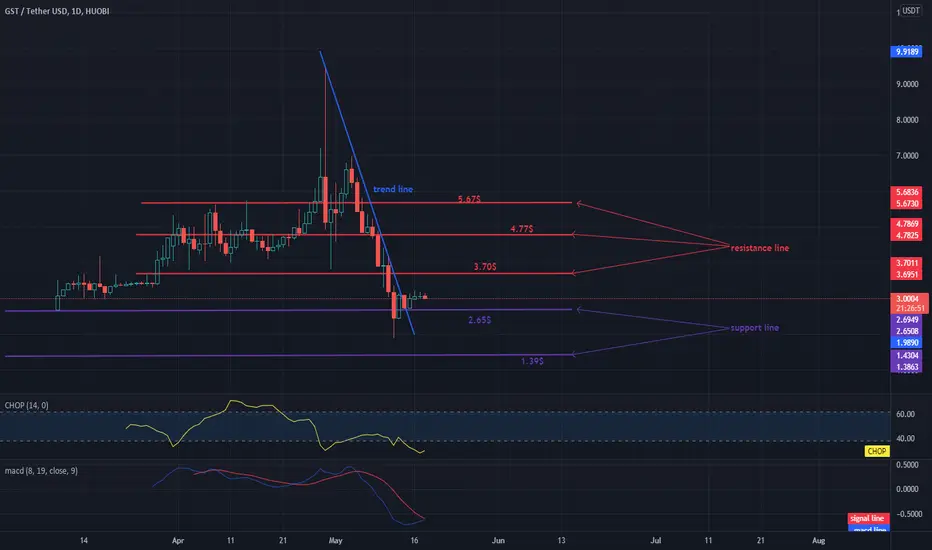
Hello everyone, let's take a look at the GST to USDT chart over the 1 day timeframe. As you can see, the price is moving above the downtrend line.
Let's start with determining the support line and as you can see the nearest support is at $ 2.65, if the support is broken, the next one is at $ 1.39.
Now let's move from the resistance line as you can see the first resistance is $ 3.70, if you can break it the next resistance will be $ 4.77 and $ 5.67.
Looking at the CHOP indicator, we can see that the energy has been used on the 1-day interval, while the MACD indicator shows that the blue line is approaching the red line if it crosses it from the bottom, it could confirm the trend change.
Let's start with determining the support line and as you can see the nearest support is at $ 2.65, if the support is broken, the next one is at $ 1.39.
Now let's move from the resistance line as you can see the first resistance is $ 3.70, if you can break it the next resistance will be $ 4.77 and $ 5.67.
Looking at the CHOP indicator, we can see that the energy has been used on the 1-day interval, while the MACD indicator shows that the blue line is approaching the red line if it crosses it from the bottom, it could confirm the trend change.

Haftungsausschluss
Die Informationen und Veröffentlichungen sind nicht als Finanz-, Anlage-, Handels- oder andere Arten von Ratschlägen oder Empfehlungen gedacht, die von TradingView bereitgestellt oder gebilligt werden, und stellen diese nicht dar. Lesen Sie mehr in den Nutzungsbedingungen.
Haftungsausschluss
Die Informationen und Veröffentlichungen sind nicht als Finanz-, Anlage-, Handels- oder andere Arten von Ratschlägen oder Empfehlungen gedacht, die von TradingView bereitgestellt oder gebilligt werden, und stellen diese nicht dar. Lesen Sie mehr in den Nutzungsbedingungen.