
I've been following HBAR since early 2020 when it dipped below 1 cent briefly and then took off.
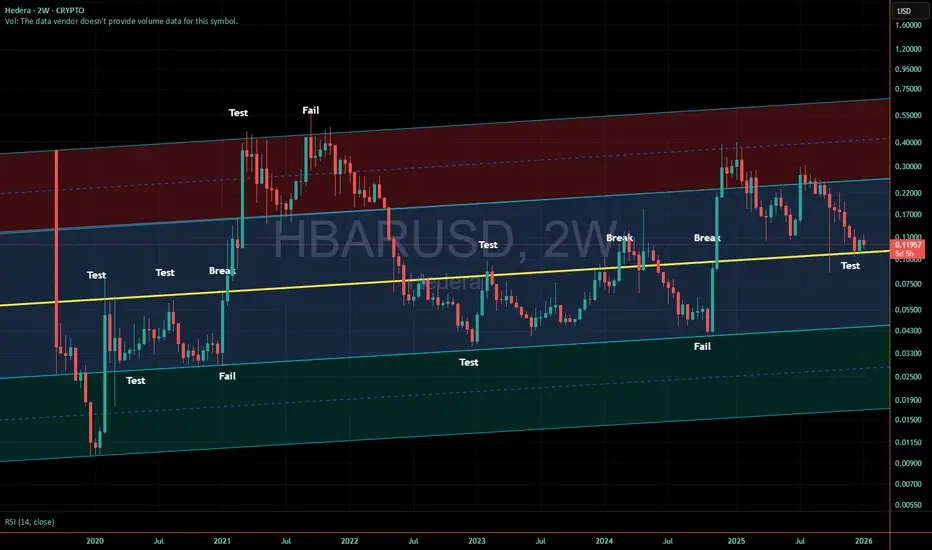
This chart is simply to show key areas of support and resistance it has been testing that are on a parallel vs the traditional horizontal S/R.
At this point, if it loses the 12 cent area around the yellow line, I'd expect a test somewhere near 4.5 cents. If that test fails to break through into the green or gets quickly bought up, it may be the last low we see in a while.
On the other hand, if the Bitcoin market drops hard affecting all crypto look to see if we see yet another move into the green box.
This chart is simply to show key areas of support and resistance it has been testing that are on a parallel vs the traditional horizontal S/R.
At this point, if it loses the 12 cent area around the yellow line, I'd expect a test somewhere near 4.5 cents. If that test fails to break through into the green or gets quickly bought up, it may be the last low we see in a while.
On the other hand, if the Bitcoin market drops hard affecting all crypto look to see if we see yet another move into the green box.

Haftungsausschluss
Die Informationen und Veröffentlichungen sind nicht als Finanz-, Anlage-, Handels- oder andere Arten von Ratschlägen oder Empfehlungen gedacht, die von TradingView bereitgestellt oder gebilligt werden, und stellen diese nicht dar. Lesen Sie mehr in den Nutzungsbedingungen.
Haftungsausschluss
Die Informationen und Veröffentlichungen sind nicht als Finanz-, Anlage-, Handels- oder andere Arten von Ratschlägen oder Empfehlungen gedacht, die von TradingView bereitgestellt oder gebilligt werden, und stellen diese nicht dar. Lesen Sie mehr in den Nutzungsbedingungen.