
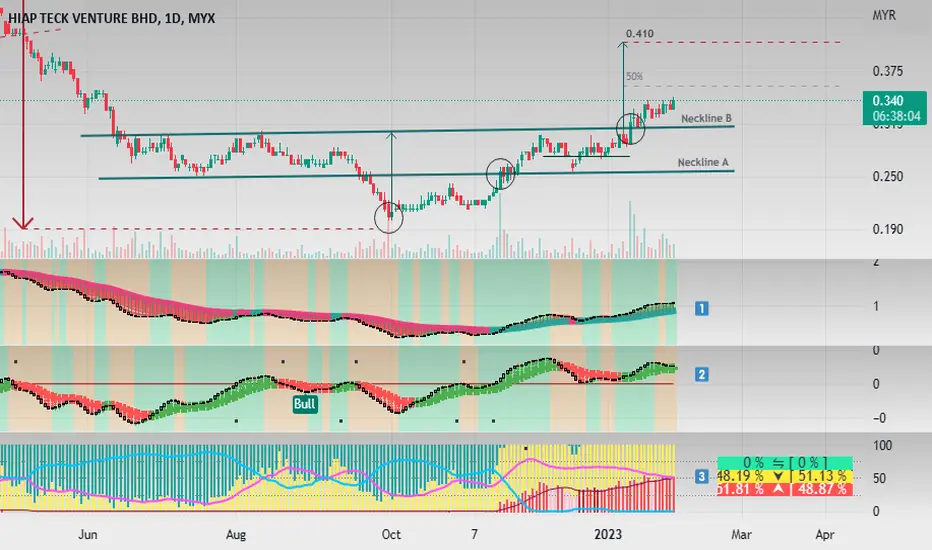
Comment for daily chart :
1) TrendX+ indicator - moves above green mid-term trendline.
2) DDX+ indicator - moves above green trend-cross and also zero-axis.
3) MCDX+ indicator - banker bar (red) getting stronger while retailer bar (turquoise) gone since the first BO of Neckline A.
4) The circles indicate higher volume activity.
Support & Resistance:
R : 0.410
S : Neckline B
DISCLAIMER :
Analysis above SOLELY for case study purpose, not a PROFESSIONAL ADVISE. This analysis does not provide any trading advise and buy or sell. Trade at your own risk. Trade only after you have acknowledged and accepted the risks involved.
1) TrendX+ indicator - moves above green mid-term trendline.
2) DDX+ indicator - moves above green trend-cross and also zero-axis.
3) MCDX+ indicator - banker bar (red) getting stronger while retailer bar (turquoise) gone since the first BO of Neckline A.
4) The circles indicate higher volume activity.
Support & Resistance:
R : 0.410
S : Neckline B
DISCLAIMER :
Analysis above SOLELY for case study purpose, not a PROFESSIONAL ADVISE. This analysis does not provide any trading advise and buy or sell. Trade at your own risk. Trade only after you have acknowledged and accepted the risks involved.
Trade geschlossen: Stop wurde erreicht
Only able to reach 50% PST
Haftungsausschluss
Die Informationen und Veröffentlichungen sind nicht als Finanz-, Anlage-, Handels- oder andere Arten von Ratschlägen oder Empfehlungen gedacht, die von TradingView bereitgestellt oder gebilligt werden, und stellen diese nicht dar. Lesen Sie mehr in den Nutzungsbedingungen.
Haftungsausschluss
Die Informationen und Veröffentlichungen sind nicht als Finanz-, Anlage-, Handels- oder andere Arten von Ratschlägen oder Empfehlungen gedacht, die von TradingView bereitgestellt oder gebilligt werden, und stellen diese nicht dar. Lesen Sie mehr in den Nutzungsbedingungen.