
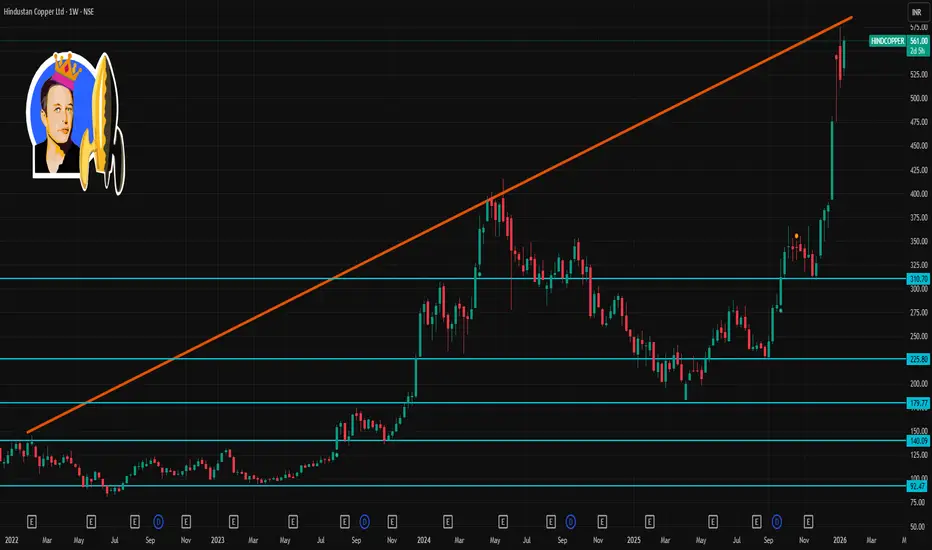
📈 Current Price (Approximate)
~₹555–₹562 per share (live intraday range) — price has recently bounced and remains elevated near short‑term highs.
🎯 1‑Week Timeframe Levels (Short‑Term View)
🟢 Resistance (Upside)
These are key zones where the stock might face selling pressure this week:
1. R1: ~₹568–₹572 — first major resistance above current levels.
2. R2: ~₹585–₹588 — next technical resistance if price sustains above near term.
3. R3: ~₹595–₹600+ — a higher breakout zone (psychological/technical barrier).
🔹 A sustained weekly close above ~₹568–₹572 would improve bullish momentum and open room toward ₹585–₹600+.
🔴 Support (Downside)
These are key floors where buyers may step in on a pullback:
1. S1: ~₹531–₹532 — immediate near‑term support from pivot and prior consolidation bands.
2. S2: ~₹523–₹525 — secondary support if short‑term pullback deepens.
3. S3: ~₹511–₹514 — stronger support area beyond typical weekly pullbacks.
🔹 A weekly close below ~₹523–₹525 risks extending short‑term selling toward ₹511–₹514.
📝 Interpretation for the Coming Week
Bullish scenario:
✅ If price trades and closes above ~₹568–₹572 → watch breakout toward ₹585–₹600+
Neutral/Range scenario:
➡ Price may consolidate between ~₹531 and ₹568 if neither strong breakout nor breakdown emerges.
Bearish scenario:
❌ A weekly downside close below ~₹523–₹525 may accelerate pullbacks toward ₹511–₹514

Contact Knowledgehub for a detailed consultation: Dm on WhatsApp: [wa.link/a2o0kz]-
Phone No: [+91 93102 26243]-
Email: [tradingviewknowledgehub@gmail.com]---
-- Let’s achieve success together!
Phone No: [+91 93102 26243]-
Email: [tradingviewknowledgehub@gmail.com]---
-- Let’s achieve success together!
Verbundene Veröffentlichungen
Haftungsausschluss
Die Informationen und Veröffentlichungen sind nicht als Finanz-, Anlage-, Handels- oder andere Arten von Ratschlägen oder Empfehlungen gedacht, die von TradingView bereitgestellt oder gebilligt werden, und stellen diese nicht dar. Lesen Sie mehr in den Nutzungsbedingungen.